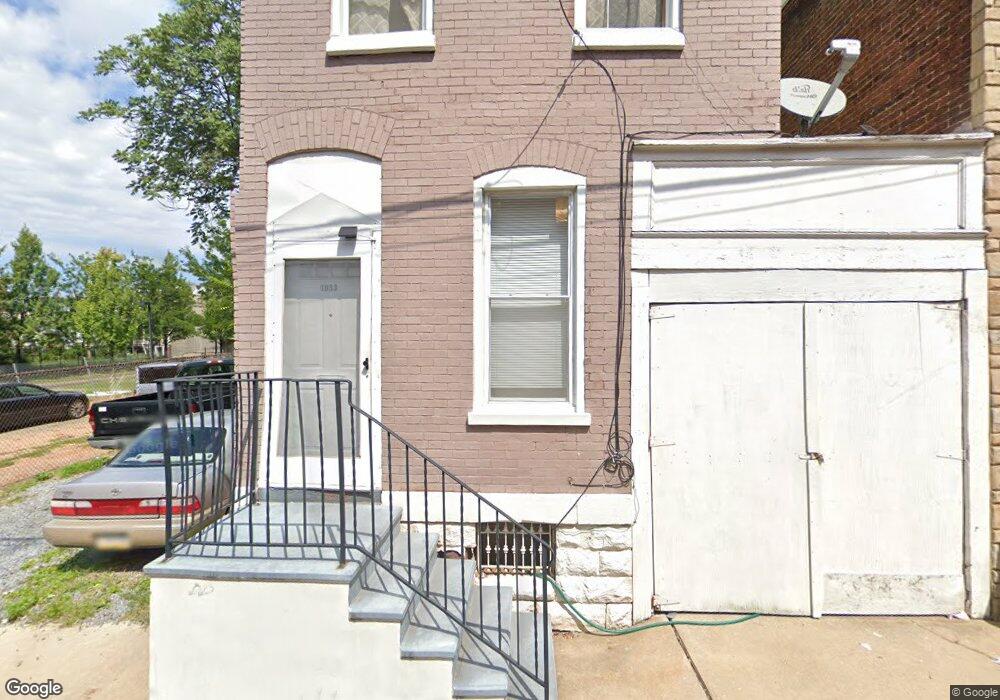
1033 Cherry St Reading, PA 19602
Penn's Common NeighborhoodEstimated Value: $76,874 - $128,000
2
Beds
1
Bath
1,216
Sq Ft
$83/Sq Ft
Est. Value
About This Home
This home is located at 1033 Cherry St, Reading, PA 19602 and is currently estimated at $100,719, approximately $82 per square foot. 1033 Cherry St is a home located in Berks County with nearby schools including Amanda E. Stout Elementary School, Southern Middle School, and Reading Senior High School.
Ownership History
Date
Name
Owned For
Owner Type
Purchase Details
Closed on
Jul 20, 2023
Sold by
Omni Property Holdings Llc
Bought by
Lower Rents Llc
Current Estimated Value
Purchase Details
Closed on
Jun 22, 2023
Sold by
Feliciano Ivan
Bought by
Omni Property Holdings Llc
Purchase Details
Closed on
Feb 22, 2022
Sold by
Suruskie Steven F
Bought by
Feliciano Ivan
Purchase Details
Closed on
Jan 23, 2009
Sold by
Graber James Robert and Graber Nelda Grace
Bought by
Suruskie Steven F
Create a Home Valuation Report for This Property
The Home Valuation Report is an in-depth analysis detailing your home's value as well as a comparison with similar homes in the area
Home Values in the Area
Average Home Value in this Area
Purchase History
| Date | Buyer | Sale Price | Title Company |
|---|---|---|---|
| Lower Rents Llc | -- | Stewart Title | |
| Omni Property Holdings Llc | $30,000 | Stewart Title | |
| Feliciano Ivan | $20,000 | Stewart Title Guaranty Company | |
| Suruskie Steven F | $7,000 | None Available |
Source: Public Records
Tax History Compared to Growth
Tax History
| Year | Tax Paid | Tax Assessment Tax Assessment Total Assessment is a certain percentage of the fair market value that is determined by local assessors to be the total taxable value of land and additions on the property. | Land | Improvement |
|---|---|---|---|---|
| 2025 | $483 | $17,800 | $6,200 | $11,600 |
| 2024 | $790 | $17,800 | $6,200 | $11,600 |
| 2023 | $778 | $17,800 | $6,200 | $11,600 |
| 2022 | $778 | $17,800 | $6,200 | $11,600 |
| 2021 | $778 | $17,800 | $6,200 | $11,600 |
| 2020 | $770 | $17,800 | $6,200 | $11,600 |
| 2019 | $770 | $17,800 | $6,200 | $11,600 |
| 2018 | $770 | $17,800 | $6,200 | $11,600 |
| 2017 | $765 | $17,800 | $6,200 | $11,600 |
| 2016 | $437 | $17,800 | $6,200 | $11,600 |
| 2015 | $437 | $17,800 | $6,200 | $11,600 |
| 2014 | $402 | $17,800 | $6,200 | $11,600 |
Source: Public Records
Map
Nearby Homes
- 42 Maple St
- 36 S 10th St
- 122 Maple St
- 1049 Penn St
- 1101 Chestnut St
- 144 S 12th St
- 816 Franklin St
- 234 Orange St
- 236 Wunder St
- 1039 Washington St
- 114 N 10th St
- 1052 Spruce St
- 316 S 10th St
- 830 Bingaman St
- 835 Washington St
- 730 Franklin St
- 1053 Muhlenberg St
- 402 S 11th St
- 1027 Walnut St
- 1230 Eckert Ave
- 1035 Cherry St
- 25 Maple St
- 1028 Penn St
- 27 Maple St
- 29 Maple St
- 31 Maple St
- 1050 Cherry St
- 1032 Cherry St
- 33 Maple St
- 1030 Cherry St
- 1052 Cherry St
- 1028 Cherry St
- 1016 Penn St Unit 7
- 1016 Penn St Unit 5
- 1018 Penn St Unit 8
- 1018 Penn St Unit 6
- 1030 Penn St
- 1026 Cherry St
- 1024 Cherry St
- 1022 Cherry St