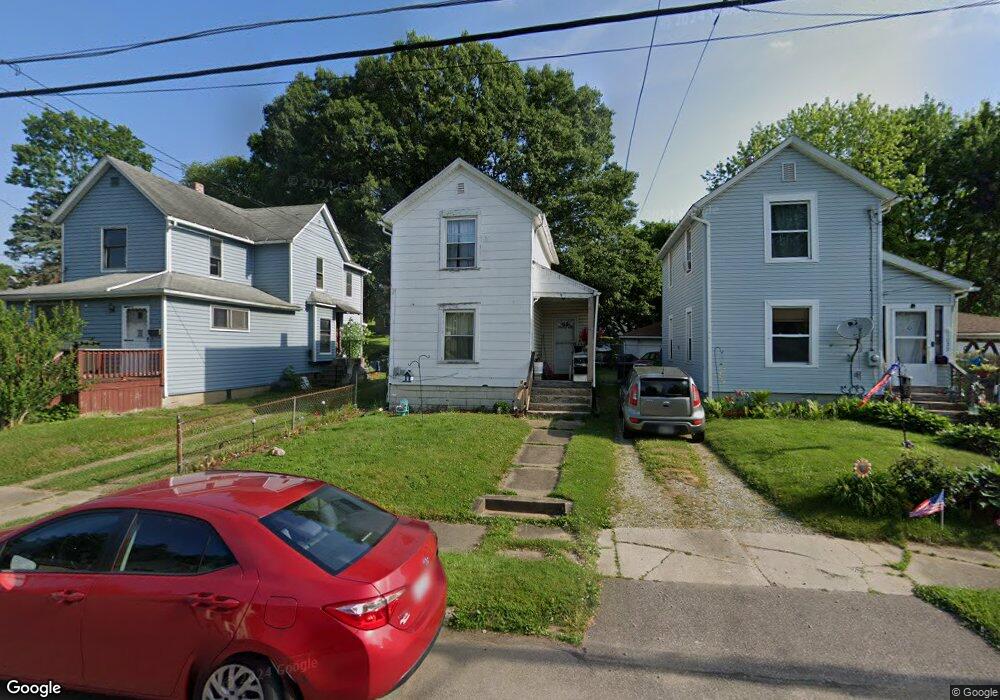
1033 Columbus Ave Barberton, OH 44203
Columbia Lake NeighborhoodEstimated Value: $33,000 - $67,000
2
Beds
1
Bath
908
Sq Ft
$56/Sq Ft
Est. Value
About This Home
This home is located at 1033 Columbus Ave, Barberton, OH 44203 and is currently estimated at $50,909, approximately $56 per square foot. 1033 Columbus Ave is a home located in Summit County with nearby schools including Barberton Middle School, Barberton High School, and St Augustine Elementary School.
Ownership History
Date
Name
Owned For
Owner Type
Purchase Details
Closed on
Sep 20, 2024
Sold by
Speegle Sandra K
Bought by
Dugger Jenevieve
Current Estimated Value
Purchase Details
Closed on
Mar 2, 2020
Sold by
Estate Of Wyatt C Speegle
Bought by
Speegle Sandra K
Purchase Details
Closed on
Dec 4, 2003
Sold by
Weitzel Christina L
Bought by
Speegle Wyatt
Purchase Details
Closed on
Sep 1, 1999
Sold by
Newton John R and Weitzel Christina L
Bought by
Weitzel Gerhard and Weitzel Christina L
Home Financials for this Owner
Home Financials are based on the most recent Mortgage that was taken out on this home.
Original Mortgage
$40,849
Interest Rate
10.35%
Purchase Details
Closed on
Jan 28, 1998
Sold by
Newton Bonnie J
Bought by
Newton John R and Weitzel Christina L
Create a Home Valuation Report for This Property
The Home Valuation Report is an in-depth analysis detailing your home's value as well as a comparison with similar homes in the area
Home Values in the Area
Average Home Value in this Area
Purchase History
| Date | Buyer | Sale Price | Title Company |
|---|---|---|---|
| Dugger Jenevieve | $30,000 | None Listed On Document | |
| Speegle Sandra K | -- | None Available | |
| Speegle Wyatt | $36,100 | Firstpointe Title Agency Inc | |
| Weitzel Gerhard | $15,000 | Tower City Title Agency Inc | |
| Newton John R | -- | -- |
Source: Public Records
Mortgage History
| Date | Status | Borrower | Loan Amount |
|---|---|---|---|
| Previous Owner | Weitzel Gerhard | $40,849 |
Source: Public Records
Tax History Compared to Growth
Tax History
| Year | Tax Paid | Tax Assessment Tax Assessment Total Assessment is a certain percentage of the fair market value that is determined by local assessors to be the total taxable value of land and additions on the property. | Land | Improvement |
|---|---|---|---|---|
| 2025 | $1,220 | $21,816 | $6,626 | $15,190 |
| 2024 | $1,220 | $21,816 | $6,626 | $15,190 |
| 2023 | $1,220 | $21,816 | $6,626 | $15,190 |
| 2022 | $883 | $13,220 | $4,015 | $9,205 |
| 2021 | $782 | $13,220 | $4,015 | $9,205 |
| 2020 | $1,341 | $13,230 | $4,020 | $9,210 |
| 2019 | $778 | $12,190 | $4,020 | $8,170 |
| 2018 | $767 | $12,190 | $4,020 | $8,170 |
| 2017 | $777 | $12,190 | $4,020 | $8,170 |
| 2016 | $779 | $12,190 | $4,020 | $8,170 |
| 2015 | $777 | $12,190 | $4,020 | $8,170 |
| 2014 | $773 | $12,190 | $4,020 | $8,170 |
| 2013 | $853 | $13,940 | $4,020 | $9,920 |
Source: Public Records
Map
Nearby Homes
- 1080 Belleview Ave
- 139 24th St NW
- 1084 Wooster Rd W
- 38 24th St NW
- 243 19th St NW
- 243 27th St NW
- 376 Hillsdale Ave
- 108 30th St NW
- 679 Wooster Rd W
- 673 Wooster Rd W
- 21 29th St SW
- 1125 Prospect St
- 32 29th St SW
- 1364 Wooster Rd W
- 3193 Trotter Rd
- 1030 Stratford St
- 524 Long Dr
- 96 Helen St
- 207 28th St SW
- V/L Benton
- 1029 Columbus Ave
- 1037 Columbus Ave
- 1041 Columbus Ave
- 96 21st St NW
- 100 21st St NW
- 94 21st St NW
- 1034 Belleview Ave
- 106 21st St NW
- 1047 Columbus Ave
- 1038 Belleview Ave
- 86 21st St NW
- 1034 Columbus Ave
- 1030 Columbus Ave
- 1038 Columbus Ave
- 1053 Columbus Ave
- 1042 Columbus Ave
- 78 21st St NW
- 112 21st St NW
- 1048 Columbus Ave
- 133 22nd St NW