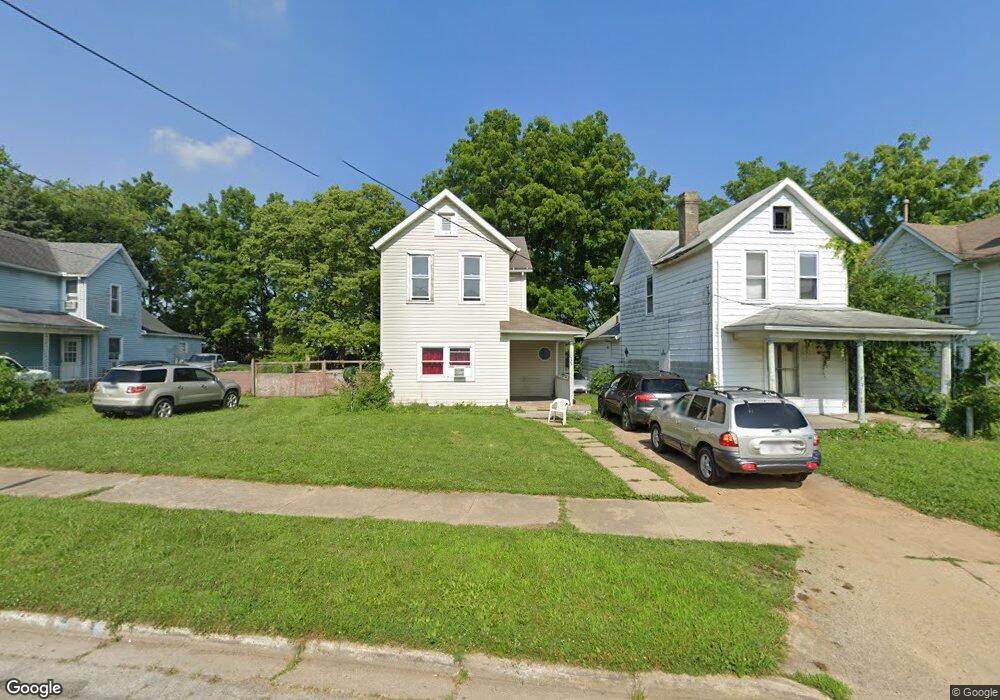
1033 Cypress St Springfield, OH 45505
Estimated Value: $86,000 - $110,000
3
Beds
2
Baths
1,542
Sq Ft
$63/Sq Ft
Est. Value
About This Home
This home is located at 1033 Cypress St, Springfield, OH 45505 and is currently estimated at $97,093, approximately $62 per square foot. 1033 Cypress St is a home located in Clark County with nearby schools including Kenwood Elementary School, Hayward Middle School, and Springfield High School.
Ownership History
Date
Name
Owned For
Owner Type
Purchase Details
Closed on
Nov 10, 2015
Sold by
Secretary Of Hud
Bought by
Peterson Micah
Current Estimated Value
Purchase Details
Closed on
Jul 30, 2014
Sold by
Bank Of America Na
Bought by
The Secretary Of Hud
Purchase Details
Closed on
May 27, 2014
Sold by
Secretary Of Housing And Urban Developme
Bought by
Bank Of America Na and Bac Dhome Loans Servicing Lp
Purchase Details
Closed on
Dec 4, 2012
Sold by
Bank Of America Na
Bought by
The Secretary Of Hud
Purchase Details
Closed on
Jul 31, 2006
Sold by
Silver Scott
Bought by
Zima Maximus W
Home Financials for this Owner
Home Financials are based on the most recent Mortgage that was taken out on this home.
Original Mortgage
$74,312
Interest Rate
6.82%
Mortgage Type
FHA
Purchase Details
Closed on
Aug 18, 2004
Sold by
Johnson Robert R
Bought by
Us Bank Na and Eqcc Home Equity Loan Trust 1999-1
Create a Home Valuation Report for This Property
The Home Valuation Report is an in-depth analysis detailing your home's value as well as a comparison with similar homes in the area
Home Values in the Area
Average Home Value in this Area
Purchase History
| Date | Buyer | Sale Price | Title Company |
|---|---|---|---|
| Peterson Micah | $16,500 | Attorney | |
| The Secretary Of Hud | -- | Nova Title Agency Inc | |
| Bank Of America Na | -- | Attorney | |
| The Secretary Of Hud | -- | Attorney | |
| Zima Maximus W | $74,900 | None Available | |
| Us Bank Na | $18,700 | Resource Title Agency Inc |
Source: Public Records
Mortgage History
| Date | Status | Borrower | Loan Amount |
|---|---|---|---|
| Previous Owner | Zima Maximus W | $74,312 |
Source: Public Records
Tax History Compared to Growth
Tax History
| Year | Tax Paid | Tax Assessment Tax Assessment Total Assessment is a certain percentage of the fair market value that is determined by local assessors to be the total taxable value of land and additions on the property. | Land | Improvement |
|---|---|---|---|---|
| 2024 | $963 | $19,500 | $2,420 | $17,080 |
| 2023 | $963 | $19,500 | $2,420 | $17,080 |
| 2022 | $987 | $19,500 | $2,420 | $17,080 |
| 2021 | $974 | $17,720 | $2,190 | $15,530 |
| 2020 | $976 | $17,720 | $2,190 | $15,530 |
| 2019 | $978 | $17,720 | $2,190 | $15,530 |
| 2018 | $859 | $14,940 | $1,830 | $13,110 |
| 2017 | $859 | $14,942 | $1,831 | $13,111 |
| 2016 | $860 | $14,942 | $1,831 | $13,111 |
| 2015 | $438 | $14,942 | $1,831 | $13,111 |
| 2014 | $873 | $14,942 | $1,831 | $13,111 |
| 2013 | $864 | $14,942 | $1,831 | $13,111 |
Source: Public Records
Map
Nearby Homes