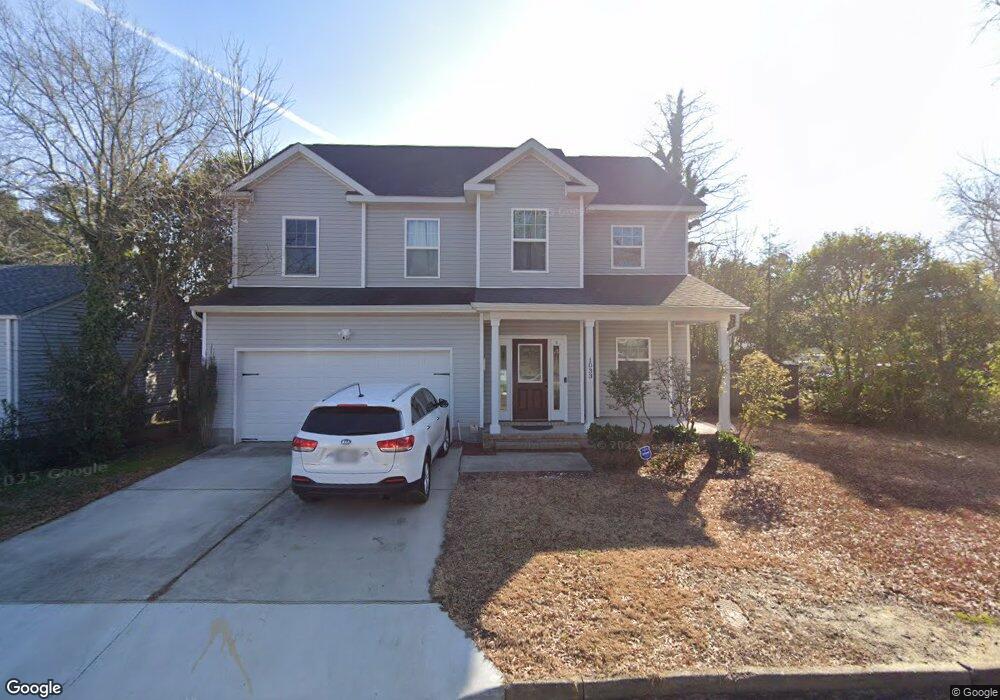
1033 Green St Norfolk, VA 23513
Norfolk Garden NeighborhoodEstimated Value: $373,000 - $441,000
4
Beds
3
Baths
2,082
Sq Ft
$197/Sq Ft
Est. Value
About This Home
This home is located at 1033 Green St, Norfolk, VA 23513 and is currently estimated at $410,847, approximately $197 per square foot. 1033 Green St is a home located in Norfolk City with nearby schools including Norview Elementary School, Norview Middle School, and Norview High School.
Ownership History
Date
Name
Owned For
Owner Type
Purchase Details
Closed on
Feb 26, 2025
Sold by
Munn Charmeka K and Kelly Charmeka
Bought by
Munn John A
Current Estimated Value
Home Financials for this Owner
Home Financials are based on the most recent Mortgage that was taken out on this home.
Original Mortgage
$170,986
Outstanding Balance
$168,615
Interest Rate
6.95%
Mortgage Type
VA
Estimated Equity
$242,232
Purchase Details
Closed on
Jun 28, 2013
Sold by
Rock Harbor Group Llc
Bought by
Munn Charmeka K
Home Financials for this Owner
Home Financials are based on the most recent Mortgage that was taken out on this home.
Original Mortgage
$245,057
Interest Rate
3.5%
Mortgage Type
VA
Purchase Details
Closed on
Nov 20, 2012
Sold by
Coley Charlie and Coley Rebecca M
Bought by
Rock Harbor Group Llc
Purchase Details
Closed on
Mar 4, 2008
Sold by
Munsey Ronald B
Bought by
Coley Charlie and Coley Rebecca M
Create a Home Valuation Report for This Property
The Home Valuation Report is an in-depth analysis detailing your home's value as well as a comparison with similar homes in the area
Home Values in the Area
Average Home Value in this Area
Purchase History
| Date | Buyer | Sale Price | Title Company |
|---|---|---|---|
| Munn John A | -- | Equity National Title | |
| Munn Charmeka K | $239,900 | Multiple | |
| Rock Harbor Group Llc | $55,000 | None Available | |
| Coley Charlie | -- | None Available |
Source: Public Records
Mortgage History
| Date | Status | Borrower | Loan Amount |
|---|---|---|---|
| Open | Munn John A | $170,986 | |
| Previous Owner | Munn Charmeka K | $245,057 |
Source: Public Records
Tax History Compared to Growth
Tax History
| Year | Tax Paid | Tax Assessment Tax Assessment Total Assessment is a certain percentage of the fair market value that is determined by local assessors to be the total taxable value of land and additions on the property. | Land | Improvement |
|---|---|---|---|---|
| 2025 | $4,893 | $391,400 | $81,500 | $309,900 |
| 2024 | $4,594 | $373,500 | $81,500 | $292,000 |
| 2023 | $4,285 | $342,800 | $81,500 | $261,300 |
| 2022 | $4,081 | $326,500 | $65,200 | $261,300 |
| 2021 | $3,695 | $295,600 | $59,300 | $236,300 |
| 2020 | $3,415 | $273,200 | $54,000 | $219,200 |
| 2019 | $3,309 | $264,700 | $54,000 | $210,700 |
| 2018 | $3,105 | $248,400 | $54,000 | $194,400 |
| 2017 | $2,743 | $238,500 | $54,000 | $184,500 |
| 2016 | $2,653 | $0 | $0 | $0 |
| 2015 | -- | $0 | $0 | $0 |
| 2014 | -- | $0 | $0 | $0 |
Source: Public Records
Map
Nearby Homes
- 976 Hugo St
- 1085 Hugo St
- 6114 Lenoir Cir
- 1088 Norview Ave
- 3854 Nansemond Cir
- 948 Defoe Ave
- 924 Norview Ave
- 6416 Palem Rd
- 3711 Abingdon Cir
- 6245 Alexander St
- 3665 Hyde Cir
- 3764 Wayne Cir
- 6459 Clare Rd
- 3711 Lenoir Cir
- 3617 Sharpley Ave
- 6262 Alexander St
- 1037 Philpotts Rd
- 1200 Underwood Ave
- 4832 Hampshire Ave
- 1203 Curie Ct