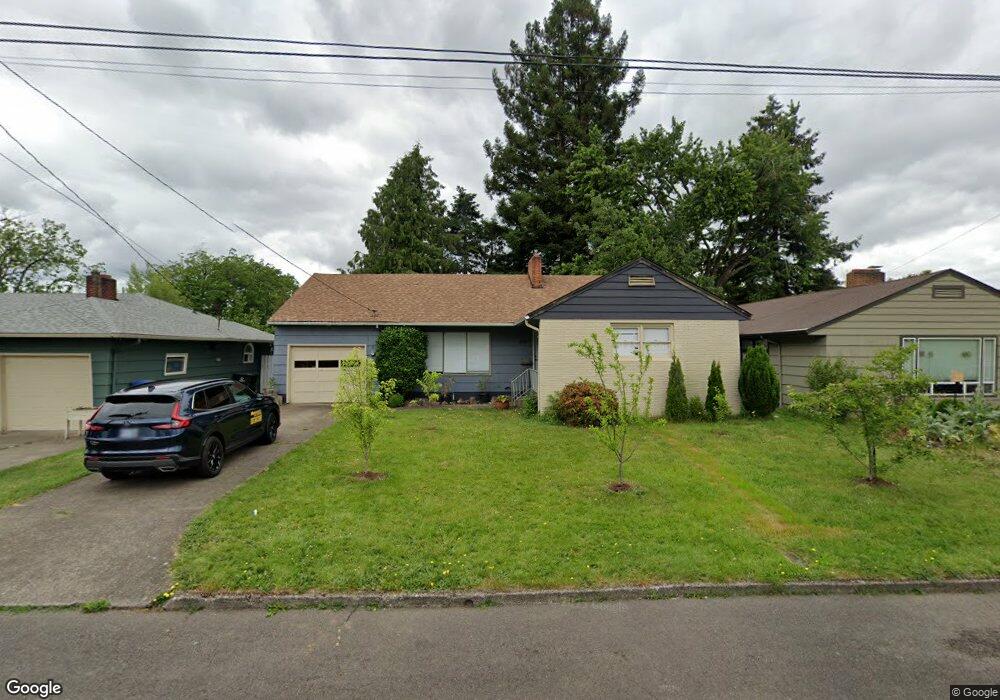
1033 Icel Ct NE Salem, OR 97301
Northeast Salem NeighborhoodEstimated Value: $390,000 - $496,000
3
Beds
2
Baths
2,024
Sq Ft
$212/Sq Ft
Est. Value
About This Home
This home is located at 1033 Icel Ct NE, Salem, OR 97301 and is currently estimated at $428,597, approximately $211 per square foot. 1033 Icel Ct NE is a home located in Marion County with nearby schools including Hoover Elementary School, Parrish Middle School, and North Salem High School.
Ownership History
Date
Name
Owned For
Owner Type
Purchase Details
Closed on
Jan 28, 2022
Sold by
Fowler Brian W
Bought by
Fowler Brian W and Smith-Fowler Glenda A
Current Estimated Value
Home Financials for this Owner
Home Financials are based on the most recent Mortgage that was taken out on this home.
Original Mortgage
$206,250
Outstanding Balance
$190,739
Interest Rate
3.22%
Mortgage Type
New Conventional
Estimated Equity
$237,858
Purchase Details
Closed on
Dec 29, 2018
Sold by
Hanks Wesley C
Bought by
Fowler Brian W and Fowler Glenda A
Home Financials for this Owner
Home Financials are based on the most recent Mortgage that was taken out on this home.
Original Mortgage
$135,200
Interest Rate
4.8%
Mortgage Type
New Conventional
Purchase Details
Closed on
Feb 15, 2008
Sold by
Kanz Larry M and Kanz Garry M
Bought by
Hanks Wesley C and Hanks Thelma J
Home Financials for this Owner
Home Financials are based on the most recent Mortgage that was taken out on this home.
Original Mortgage
$162,450
Interest Rate
5.85%
Mortgage Type
FHA
Create a Home Valuation Report for This Property
The Home Valuation Report is an in-depth analysis detailing your home's value as well as a comparison with similar homes in the area
Home Values in the Area
Average Home Value in this Area
Purchase History
| Date | Buyer | Sale Price | Title Company |
|---|---|---|---|
| Fowler Brian W | $91,000 | Accommodation/Courtesy Recordi | |
| Fowler Brian W | $169,000 | Fidelity National Title | |
| Hanks Wesley C | $165,000 | Amerititle |
Source: Public Records
Mortgage History
| Date | Status | Borrower | Loan Amount |
|---|---|---|---|
| Open | Fowler Brian W | $206,250 | |
| Previous Owner | Fowler Brian W | $135,200 | |
| Previous Owner | Hanks Wesley C | $162,450 |
Source: Public Records
Tax History Compared to Growth
Tax History
| Year | Tax Paid | Tax Assessment Tax Assessment Total Assessment is a certain percentage of the fair market value that is determined by local assessors to be the total taxable value of land and additions on the property. | Land | Improvement |
|---|---|---|---|---|
| 2024 | $3,695 | $188,210 | -- | -- |
| 2023 | $3,586 | $182,730 | $0 | $0 |
| 2022 | $3,382 | $177,410 | $0 | $0 |
| 2021 | $3,285 | $172,250 | $0 | $0 |
| 2020 | $3,189 | $167,240 | $0 | $0 |
| 2019 | $3,077 | $162,370 | $0 | $0 |
| 2018 | $3,132 | $0 | $0 | $0 |
| 2017 | $2,827 | $0 | $0 | $0 |
| 2016 | $2,692 | $0 | $0 | $0 |
| 2015 | $2,713 | $0 | $0 | $0 |
| 2014 | $2,584 | $0 | $0 | $0 |
Source: Public Records
Map
Nearby Homes
- 1148 Icel Ct NE
- 1029 Evergreen Ave NE
- 2704 D St NE
- 2752 D St NE
- 1015 Park Ave NE Unit 1025
- 967 Park Ave NE
- 1212 23rd St NE
- 2955 Wedgewood Ct NE
- 3027 D St NE
- 2980 Ellis Ave NE
- 1350 30th Ave NE
- 3103 Tess Ave NE
- 2965 Fredrick St NE
- 3152 Tess Ave NE
- 1567 Park Ave NE
- 1530 25th St NE
- 3194 Knox Ave NE
- 3257 Ladd Ave NE
- 578 23rd St NE
- 1175 19th St NE
- 1053 Icel Ct NE
- 1013 Icel Ct NE
- 1068 Evergreen Ave NE
- 1093 Icel Ct NE
- 1048 Evergreen Ave NE
- 1088 Evergreen Ave NE
- 2645 D St NE
- 1128 Evergreen Ave NE
- 1018 Icel Ct NE
- 1018 Evergreen Ave NE
- 1113 Icel Ct NE
- 1038 Icel Ct NE
- 1008 Icel Ct NE
- 1068 Icel Ct NE
- 1148 Evergreen Ave NE
- 1088 Icel Ct NE
- 1133 Icel Ct NE
- 2745 D St NE
- 1128 Icel Ct NE
- 1168 Evergreen Ave NE