Estimated Value: $321,743 - $348,000
3
Beds
2
Baths
1,827
Sq Ft
$183/Sq Ft
Est. Value
About This Home
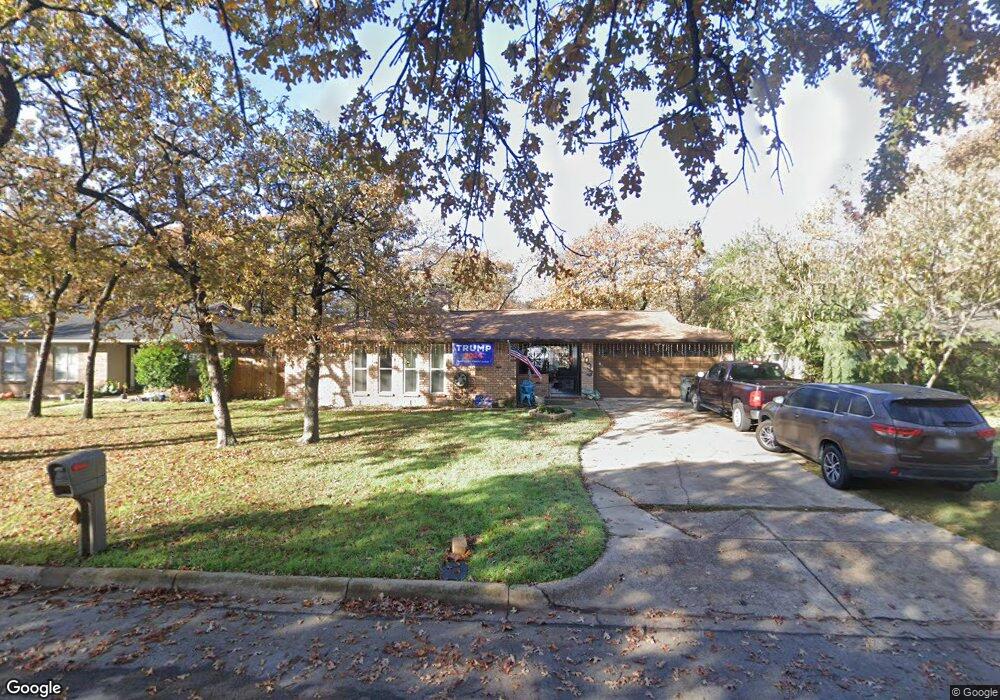
This home is located at 1033 Keith Dr, Hurst, TX 76053 and is currently estimated at $333,936, approximately $182 per square foot. 1033 Keith Dr is a home located in Tarrant County with nearby schools including Harrison Lane Elementary School, Hurst J High School, and L.D. Bell High School.
Ownership History
Date
Name
Owned For
Owner Type
Purchase Details
Closed on
Mar 12, 2015
Sold by
Armstrong James and Armstrong Ramona
Bought by
Armstrong Living Trust
Current Estimated Value
Purchase Details
Closed on
Jul 19, 2012
Sold by
Estes Joel A and Estes Jean E
Bought by
Armstrong Ramona
Home Financials for this Owner
Home Financials are based on the most recent Mortgage that was taken out on this home.
Original Mortgage
$86,000
Outstanding Balance
$59,449
Interest Rate
3.7%
Mortgage Type
New Conventional
Estimated Equity
$274,487
Purchase Details
Closed on
Dec 18, 1999
Sold by
Oertel Patricia A
Bought by
Estes Joel A and Estes Jean E
Home Financials for this Owner
Home Financials are based on the most recent Mortgage that was taken out on this home.
Original Mortgage
$98,900
Interest Rate
7.69%
Create a Home Valuation Report for This Property
The Home Valuation Report is an in-depth analysis detailing your home's value as well as a comparison with similar homes in the area
Home Values in the Area
Average Home Value in this Area
Purchase History
| Date | Buyer | Sale Price | Title Company |
|---|---|---|---|
| Armstrong Living Trust | -- | None Available | |
| Armstrong Ramona | -- | None Available | |
| Estes Joel A | -- | Alamo Title Company |
Source: Public Records
Mortgage History
| Date | Status | Borrower | Loan Amount |
|---|---|---|---|
| Open | Armstrong Ramona | $86,000 | |
| Previous Owner | Estes Joel A | $98,900 |
Source: Public Records
Tax History
| Year | Tax Paid | Tax Assessment Tax Assessment Total Assessment is a certain percentage of the fair market value that is determined by local assessors to be the total taxable value of land and additions on the property. | Land | Improvement |
|---|---|---|---|---|
| 2025 | $1,947 | $322,760 | $65,000 | $257,760 |
| 2024 | $1,947 | $322,760 | $65,000 | $257,760 |
| 2023 | $4,861 | $303,173 | $40,000 | $263,173 |
| 2022 | $5,079 | $246,861 | $40,000 | $206,861 |
| 2021 | $4,837 | $246,861 | $40,000 | $206,861 |
| 2020 | $4,386 | $213,154 | $40,000 | $173,154 |
| 2019 | $4,056 | $213,154 | $40,000 | $173,154 |
| 2018 | $3,131 | $150,669 | $19,000 | $131,669 |
| 2017 | $3,466 | $174,791 | $19,000 | $155,791 |
| 2016 | $3,151 | $148,271 | $19,000 | $129,271 |
| 2015 | $2,556 | $113,200 | $15,000 | $98,200 |
| 2014 | $2,556 | $113,200 | $15,000 | $98,200 |
Source: Public Records
Map
Nearby Homes
- 1016 Keith Dr
- 153 Sheri Ln
- 1113 Norwood Dr
- 1148 Simpson Dr
- 1160 Harrison Ln
- 209 W Cedar St
- 1112 Karla Dr
- 936 Barbara Ann Dr
- 701 Harrison Ln
- 905 Brown Trail
- 629 Harrison Ln
- 1236 Harrison Ln
- 802 Brown Trail
- 609 Norwood Dr
- 552 Norwood Dr
- 624 Forest Ln
- 341 Hurst Dr
- 344 Bedford Ct E
- 709 Hurstview Dr
- 528 Buena Vista Dr
Your Personal Tour Guide
Ask me questions while you tour the home.