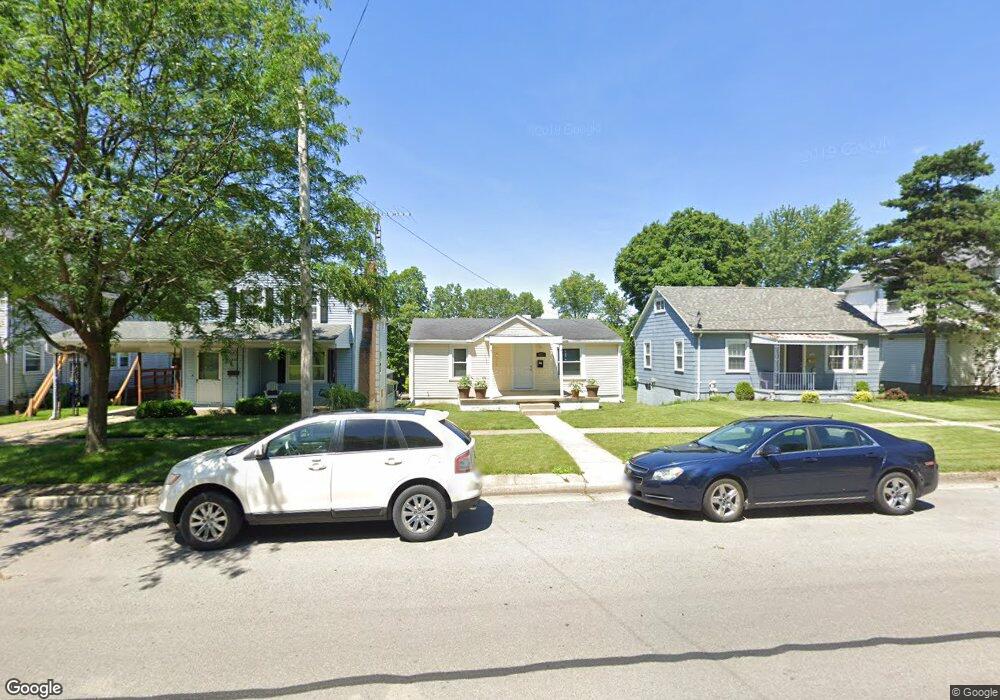
1033 N Main Ave Sidney, OH 45365
Estimated Value: $136,776 - $171,000
2
Beds
2
Baths
960
Sq Ft
$157/Sq Ft
Est. Value
About This Home
This home is located at 1033 N Main Ave, Sidney, OH 45365 and is currently estimated at $150,944, approximately $157 per square foot. 1033 N Main Ave is a home located in Shelby County with nearby schools including Sidney High School, Holy Angels Catholic School, and Christian Academy Schools.
Ownership History
Date
Name
Owned For
Owner Type
Purchase Details
Closed on
Feb 22, 2011
Sold by
Conet Inc
Bought by
Laub Tracy L
Current Estimated Value
Home Financials for this Owner
Home Financials are based on the most recent Mortgage that was taken out on this home.
Original Mortgage
$78,858
Outstanding Balance
$53,909
Interest Rate
4.76%
Mortgage Type
New Conventional
Estimated Equity
$97,035
Purchase Details
Closed on
Oct 1, 2010
Sold by
Perkins Erman F and Perkins Amy L
Bought by
Conet Inc and 1033 North Main Avenue Sidney Residentia
Purchase Details
Closed on
Oct 29, 2007
Sold by
Wick Norma Jean
Bought by
Perkins Erman F and Perkins Amy L
Home Financials for this Owner
Home Financials are based on the most recent Mortgage that was taken out on this home.
Original Mortgage
$76,794
Interest Rate
6.38%
Mortgage Type
Purchase Money Mortgage
Create a Home Valuation Report for This Property
The Home Valuation Report is an in-depth analysis detailing your home's value as well as a comparison with similar homes in the area
Home Values in the Area
Average Home Value in this Area
Purchase History
| Date | Buyer | Sale Price | Title Company |
|---|---|---|---|
| Laub Tracy L | $76,000 | Partners Land Title Agency | |
| Conet Inc | -- | None Available | |
| Perkins Erman F | $78,000 | Midwest Title Company |
Source: Public Records
Mortgage History
| Date | Status | Borrower | Loan Amount |
|---|---|---|---|
| Open | Laub Tracy L | $78,858 | |
| Previous Owner | Perkins Erman F | $76,794 |
Source: Public Records
Tax History
| Year | Tax Paid | Tax Assessment Tax Assessment Total Assessment is a certain percentage of the fair market value that is determined by local assessors to be the total taxable value of land and additions on the property. | Land | Improvement |
|---|---|---|---|---|
| 2024 | $1,005 | $29,040 | $6,150 | $22,890 |
| 2023 | $1,019 | $29,040 | $6,150 | $22,890 |
| 2022 | $878 | $21,920 | $4,440 | $17,480 |
| 2021 | $887 | $21,920 | $4,440 | $17,480 |
| 2020 | $887 | $21,920 | $4,440 | $17,480 |
| 2019 | $811 | $20,120 | $3,750 | $16,370 |
| 2018 | $799 | $20,120 | $3,750 | $16,370 |
| 2017 | $791 | $20,120 | $3,750 | $16,370 |
| 2016 | $701 | $17,800 | $3,750 | $14,050 |
| 2015 | $685 | $17,350 | $3,750 | $13,600 |
| 2014 | $685 | $17,350 | $3,750 | $13,600 |
| 2013 | $697 | $16,320 | $3,750 | $12,570 |
Source: Public Records
Map
Nearby Homes
- 1027 N Main Ave
- 317 E Bennett St
- 1302 N Main Ave
- 306 Belmont St
- 1402 N Main Ave
- 418 Kossuth St
- 834 N West Ave
- 808 N Main Ave
- 402 New St
- 430 New St
- 400 Jefferson St
- 747 Clinton Ave
- 718 Addy Ave
- 308 E Lyndhurst St
- 120 Bon Air Dr
- 307 E Ruth St
- 115 E Pinehurst St
- 1356 Shaggy Bark Dr
- 1500 Port Jefferson Rd
- 300 N Miami Ave
- 1039 N Main Ave
- 1031 N Main Ave
- 1043 N Main Ave
- 1023 N Main Ave
- 1019 N Main Ave
- 1047 N Main Ave
- 1036 N Main Ave
- 1038 N Main Ave
- 1038 N Main Ave
- 1044 N Main Ave
- 1049 N Main Ave
- 1015 N Main Ave
- 1046 N Main Ave
- 1020 N Main Ave
- 1051 N Main Ave
- 1050 N Main Ave
- 107 W Bennett St
- 1016 N Main Ave
- 1011 N Main Ave
- 1055 N Main Ave
Your Personal Tour Guide
Ask me questions while you tour the home.