Estimated Value: $324,000 - $358,000
4
Beds
2
Baths
1,760
Sq Ft
$193/Sq Ft
Est. Value
About This Home
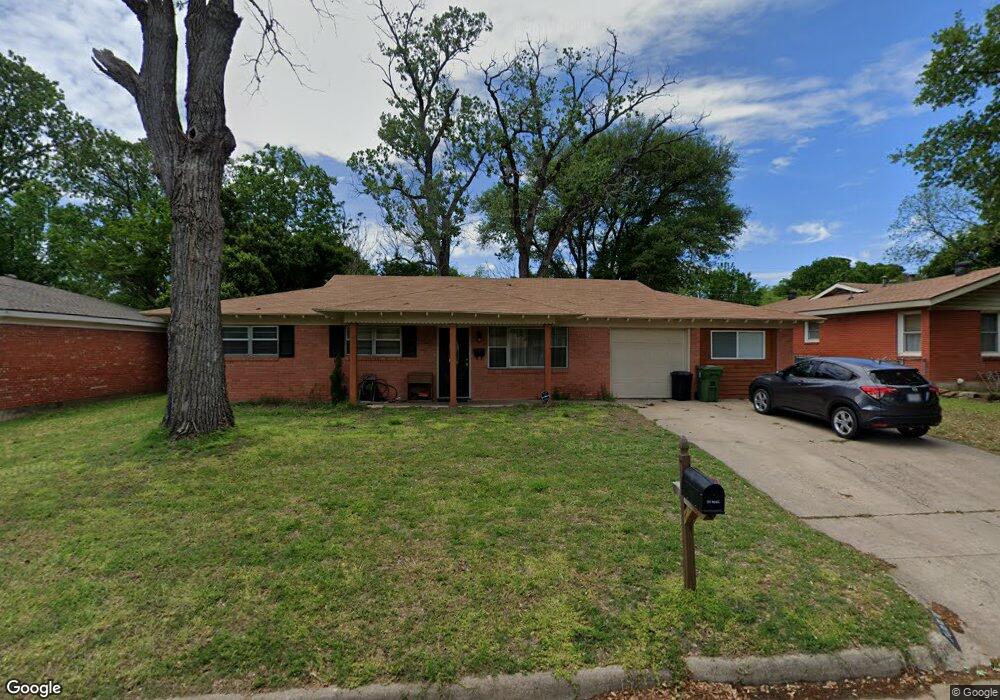
This home is located at 1033 Reed St, Hurst, TX 76053 and is currently estimated at $339,086, approximately $192 per square foot. 1033 Reed St is a home located in Tarrant County with nearby schools including Harrison Lane Elementary School, Hurst J High School, and L.D. Bell High School.
Ownership History
Date
Name
Owned For
Owner Type
Purchase Details
Closed on
May 27, 2016
Sold by
Bronson Zagaye
Bought by
Lavalley Heather and Lavalley Justin
Current Estimated Value
Home Financials for this Owner
Home Financials are based on the most recent Mortgage that was taken out on this home.
Original Mortgage
$170,810
Outstanding Balance
$135,990
Interest Rate
3.58%
Mortgage Type
New Conventional
Estimated Equity
$203,096
Purchase Details
Closed on
Apr 22, 2016
Sold by
Teames Sallie Bishop
Bought by
Bronson Zugaye
Home Financials for this Owner
Home Financials are based on the most recent Mortgage that was taken out on this home.
Original Mortgage
$170,810
Outstanding Balance
$135,990
Interest Rate
3.58%
Mortgage Type
New Conventional
Estimated Equity
$203,096
Purchase Details
Closed on
Feb 12, 2016
Sold by
Teames John
Bought by
Bronson Zugaye
Purchase Details
Closed on
Jul 22, 2015
Sold by
Teames Sallie Bishop and Teames Sallie
Bought by
Teames John and The Sallie Bishop Teames Revocaeble Livi
Purchase Details
Closed on
Mar 21, 1996
Sold by
Teames David
Bought by
Teames Sallie
Create a Home Valuation Report for This Property
The Home Valuation Report is an in-depth analysis detailing your home's value as well as a comparison with similar homes in the area
Home Values in the Area
Average Home Value in this Area
Purchase History
| Date | Buyer | Sale Price | Title Company |
|---|---|---|---|
| Lavalley Heather | -- | Stewart Lender Services | |
| Bronson Zugaye | -- | None Available | |
| Bronson Zugaye | -- | Sendera Title | |
| Teames John | -- | None Available | |
| Teames Sallie | -- | -- |
Source: Public Records
Mortgage History
| Date | Status | Borrower | Loan Amount |
|---|---|---|---|
| Open | Lavalley Heather | $170,810 |
Source: Public Records
Tax History Compared to Growth
Tax History
| Year | Tax Paid | Tax Assessment Tax Assessment Total Assessment is a certain percentage of the fair market value that is determined by local assessors to be the total taxable value of land and additions on the property. | Land | Improvement |
|---|---|---|---|---|
| 2025 | $3,902 | $311,000 | $65,000 | $246,000 |
| 2024 | $3,902 | $318,706 | $65,000 | $253,706 |
| 2023 | $4,848 | $291,013 | $40,000 | $251,013 |
| 2022 | $5,065 | $268,924 | $40,000 | $228,924 |
| 2021 | $4,824 | $200,000 | $40,000 | $160,000 |
| 2020 | $4,812 | $200,000 | $40,000 | $160,000 |
| 2019 | $4,894 | $208,432 | $40,000 | $168,432 |
| 2018 | $3,857 | $181,791 | $19,000 | $162,791 |
| 2017 | $4,740 | $187,300 | $19,000 | $168,300 |
| 2016 | $2,683 | $128,776 | $19,000 | $109,776 |
| 2015 | $1,299 | $96,400 | $15,000 | $81,400 |
| 2014 | $1,299 | $96,400 | $15,000 | $81,400 |
Source: Public Records
Map
Nearby Homes
- 1016 Keith Dr
- 400 Joanna Dr
- 1136 Simpson Dr
- 420 Bedford Ct W
- 409 Vicki Place
- 127 W Cedar St
- 1208 Karla Dr
- 624 Harrison Ln
- 905 Brown Trail
- 1220 Norwood Dr
- 231 Elm St
- 802 Brown Trail
- 644 Caduceus Ln
- 803 Glenda Dr
- 552 Norwood Dr
- 1208 Birch St
- 632 Forest Ln
- 708 Hurstview Dr
- 1145 Terrace Trail
- 341 Hurst Dr