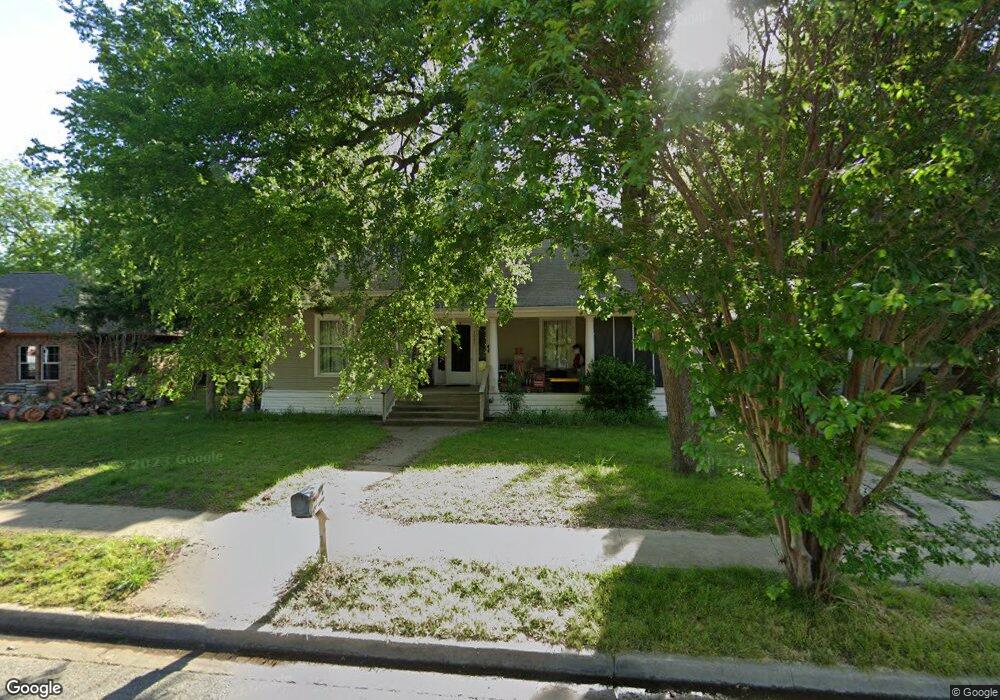
1033 S Travis St Sherman, TX 75090
Estimated Value: $288,000 - $344,103
4
Beds
4
Baths
2,260
Sq Ft
$140/Sq Ft
Est. Value
About This Home
This home is located at 1033 S Travis St, Sherman, TX 75090 and is currently estimated at $316,052, approximately $139 per square foot. 1033 S Travis St is a home located in Grayson County with nearby schools including Washington Elementary School, Piner Middle School, and Dillingham Intermediate School.
Ownership History
Date
Name
Owned For
Owner Type
Purchase Details
Closed on
Mar 1, 2016
Sold by
Mcmillian William M
Bought by
Acacia Management Llc
Current Estimated Value
Home Financials for this Owner
Home Financials are based on the most recent Mortgage that was taken out on this home.
Original Mortgage
$85,000
Outstanding Balance
$67,633
Interest Rate
3.81%
Mortgage Type
Assumption
Estimated Equity
$248,419
Create a Home Valuation Report for This Property
The Home Valuation Report is an in-depth analysis detailing your home's value as well as a comparison with similar homes in the area
Home Values in the Area
Average Home Value in this Area
Purchase History
| Date | Buyer | Sale Price | Title Company |
|---|---|---|---|
| Acacia Management Llc | -- | None Available |
Source: Public Records
Mortgage History
| Date | Status | Borrower | Loan Amount |
|---|---|---|---|
| Open | Acacia Management Llc | $85,000 |
Source: Public Records
Tax History Compared to Growth
Tax History
| Year | Tax Paid | Tax Assessment Tax Assessment Total Assessment is a certain percentage of the fair market value that is determined by local assessors to be the total taxable value of land and additions on the property. | Land | Improvement |
|---|---|---|---|---|
| 2025 | $3,203 | $230,987 | -- | -- |
| 2024 | $4,606 | $209,988 | $0 | $0 |
| 2023 | $2,790 | $190,898 | $0 | $0 |
| 2022 | $4,067 | $173,544 | $0 | $0 |
| 2021 | $3,954 | $157,767 | $15,621 | $142,146 |
| 2020 | $4,266 | $162,550 | $15,621 | $146,929 |
| 2019 | $4,492 | $166,643 | $9,809 | $156,834 |
| 2018 | $4,123 | $164,342 | $7,750 | $156,592 |
| 2017 | $2,164 | $86,922 | $3,802 | $83,120 |
| 2016 | $1,679 | $67,463 | $3,802 | $63,661 |
| 2015 | $1,415 | $56,970 | $3,802 | $53,168 |
| 2014 | $1,405 | $56,568 | $3,802 | $52,766 |
Source: Public Records
Map
Nearby Homes
- 419 S Montgomery St
- 1114 S Crockett St
- 1219 S Montgomery St
- TBD S Branch St
- TBD Branch St
- 000 S Branch St
- 929 S Montgomery St
- 1220 S Branch St
- 1326 S Walnut St
- 1323 S Montgomery St
- 303 W Steadman St
- 819 S Crockett St
- 306 W Moore St
- 801 S Walnut St
- 621 S Rusk St
- 1228 S Rusk St
- 725 S Walnut St
- 411 W Hester St
- 717 S Elm St
- 920 S Austin St
- 1035 S Travis St
- 1031 S Travis St
- 1027 S Travis St
- 1034 S Walnut St
- 1032 S Walnut St
- 1113 S Travis St
- 1106 S Walnut St
- 1019 S Travis St
- 1100 S Walnut St
- 1028 S Walnut St
- 115 W Mockingbird Ln
- 1115 S Travis St
- 1028 S Travis St
- 1104 S Travis St
- 1108 S Walnut St
- 1011 S Travis St
- 1018 S Walnut St
- 1108 S Travis St
- 1020 S Travis St
- 1117 S Travis St