Estimated Value: $144,935 - $211,000
2
Beds
1
Bath
1,056
Sq Ft
$171/Sq Ft
Est. Value
About This Home
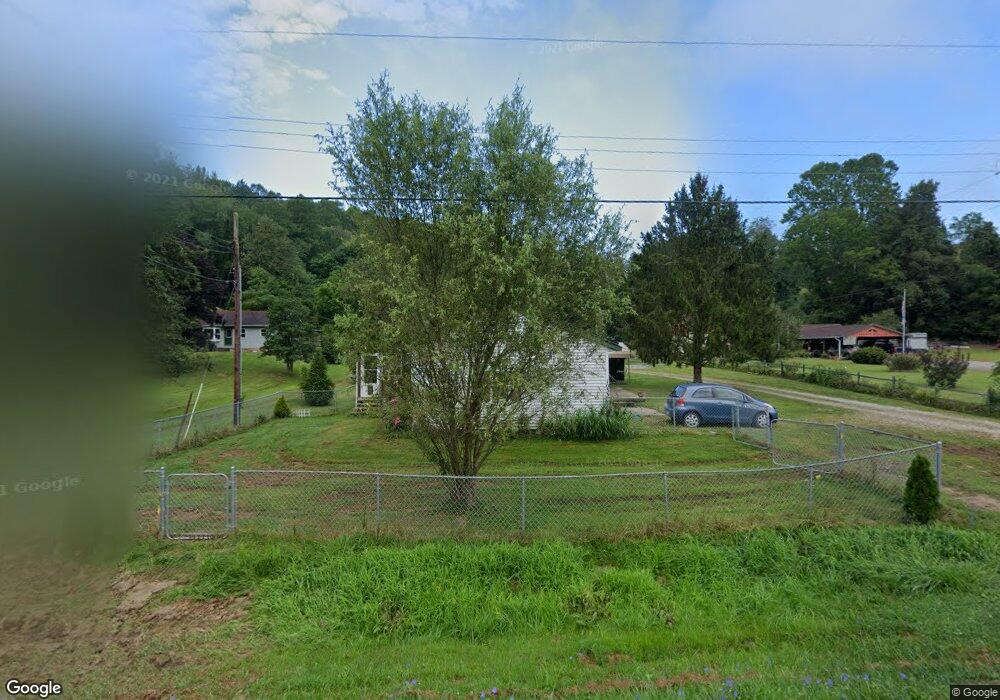
This home is located at 1033 State Route 664 N, Logan, OH 43138 and is currently estimated at $180,734, approximately $171 per square foot. 1033 State Route 664 N is a home located in Hocking County with nearby schools including Chieftain Elementary School, St. John the Evangelist School, and Logan Christian School.
Ownership History
Date
Name
Owned For
Owner Type
Purchase Details
Closed on
Oct 15, 2016
Sold by
Harris Michael D and Harris Bonnie L
Bought by
Elick Ronald E and Elick Cammie J
Current Estimated Value
Home Financials for this Owner
Home Financials are based on the most recent Mortgage that was taken out on this home.
Original Mortgage
$48,000
Outstanding Balance
$30,931
Interest Rate
3.75%
Mortgage Type
Adjustable Rate Mortgage/ARM
Estimated Equity
$149,803
Purchase Details
Closed on
Jun 20, 2012
Sold by
Secratary Of Housing And Urban Developme
Bought by
Harris Michael D and Harris Bonnie L
Home Financials for this Owner
Home Financials are based on the most recent Mortgage that was taken out on this home.
Original Mortgage
$31,500
Interest Rate
3.64%
Mortgage Type
Purchase Money Mortgage
Purchase Details
Closed on
Mar 19, 2012
Sold by
Pnc Mortgage
Bought by
Housing And Urbank Developmet
Purchase Details
Closed on
Sep 6, 2011
Sold by
Deubenmire John S and Deubenmire John Scott
Bought by
Pnc Mortgage N A
Create a Home Valuation Report for This Property
The Home Valuation Report is an in-depth analysis detailing your home's value as well as a comparison with similar homes in the area
Home Values in the Area
Average Home Value in this Area
Purchase History
| Date | Buyer | Sale Price | Title Company |
|---|---|---|---|
| Elick Ronald E | $60,000 | None Available | |
| Harris Michael D | $35,000 | None Available | |
| Housing And Urbank Developmet | -- | None Available | |
| Pnc Mortgage N A | $47,000 | None Available |
Source: Public Records
Mortgage History
| Date | Status | Borrower | Loan Amount |
|---|---|---|---|
| Open | Elick Ronald E | $48,000 | |
| Previous Owner | Harris Michael D | $31,500 |
Source: Public Records
Tax History Compared to Growth
Tax History
| Year | Tax Paid | Tax Assessment Tax Assessment Total Assessment is a certain percentage of the fair market value that is determined by local assessors to be the total taxable value of land and additions on the property. | Land | Improvement |
|---|---|---|---|---|
| 2024 | $1,150 | $29,850 | $6,290 | $23,560 |
| 2023 | $1,150 | $29,850 | $6,290 | $23,560 |
| 2022 | $1,152 | $29,850 | $6,290 | $23,560 |
| 2021 | $1,050 | $25,540 | $5,240 | $20,300 |
| 2020 | $1,046 | $25,540 | $5,240 | $20,300 |
| 2019 | $1,046 | $25,540 | $5,240 | $20,300 |
| 2018 | $993 | $24,780 | $4,480 | $20,300 |
| 2017 | $975 | $24,780 | $4,480 | $20,300 |
| 2016 | $968 | $24,780 | $4,480 | $20,300 |
| 2015 | $964 | $23,830 | $4,460 | $19,370 |
| 2014 | $965 | $23,830 | $4,460 | $19,370 |
| 2013 | $969 | $23,830 | $4,460 | $19,370 |
Source: Public Records
Map
Nearby Homes
- 1288 4th St
- 1096 Church St
- 737 Glenwood Dr
- 605 Glenwood Dr
- 331 Short St
- 0 Chieftain Dr
- 150 Wood St
- 171 Warner Ave
- 597 Henrietta Ave
- 385 W Main St
- 1139 Old McArthur Rd
- 862 Walnut Dowler Rd
- 687 N Walnut St
- 733 Walnut Dr
- 288 Walnut Dr
- 582 N Walnut St
- 67 W Front St
- 825 Edgehill Dr
- 28583 Hawthorne Way
- 707 Edgehill Dr
- 1053 State Route 664 N
- 1041 State Route 664 N
- 1023 State Route 664 N
- 1030 State Route 664 N
- 1959 Ohio 664
- 1063 State Route 664 N
- 1020 State Route 664 N
- 1010 State Route 664 N
- 1003 State Route 664 N
- 974 State Route 664 N
- 960 State Route 664 N
- 11959 Ohio 664
- 11959 State Route 664 N
- 936 State Route 664 N
- 910 State Route 664 N
- 925 State Route 664 N
- 900 State Route 664 N
- 937 Ohio 664
- 884 State Route 664 N
- 906 State Route 664 N