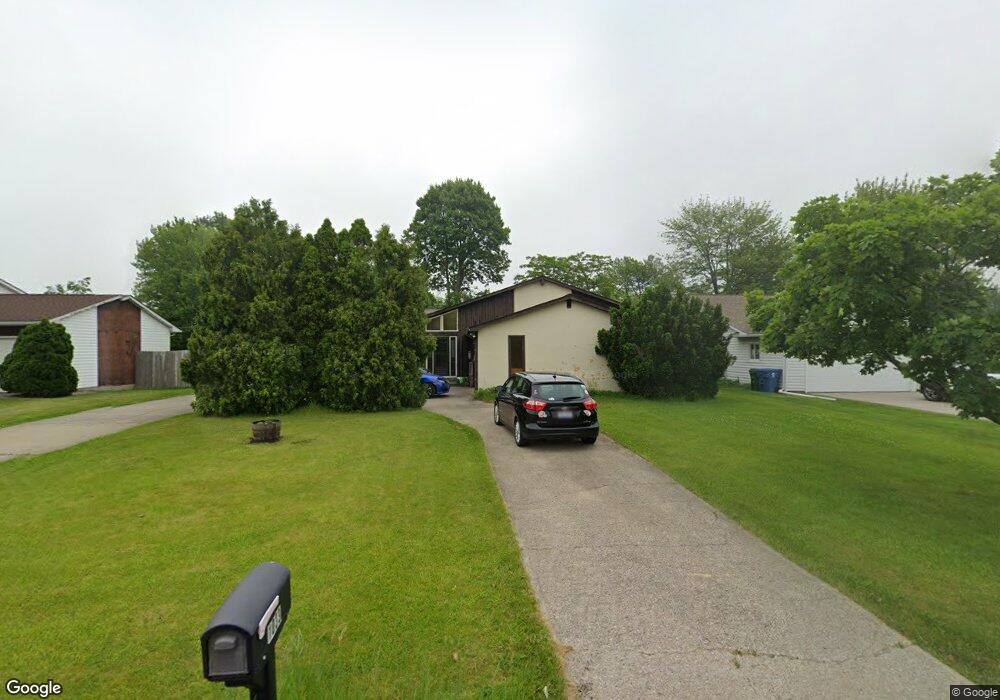
1033 Terra Ln Amherst, OH 44001
Estimated Value: $253,000 - $283,000
4
Beds
2
Baths
2,020
Sq Ft
$129/Sq Ft
Est. Value
About This Home
This home is located at 1033 Terra Ln, Amherst, OH 44001 and is currently estimated at $261,559, approximately $129 per square foot. 1033 Terra Ln is a home located in Lorain County with nearby schools including Powers Elementary School, Walter G. Nord Middle School, and Amherst Junior High School.
Ownership History
Date
Name
Owned For
Owner Type
Purchase Details
Closed on
Dec 18, 2013
Sold by
Flesch Shanyn L and Mccourt Christopher
Bought by
Thomas Jessica
Current Estimated Value
Home Financials for this Owner
Home Financials are based on the most recent Mortgage that was taken out on this home.
Original Mortgage
$106,043
Outstanding Balance
$80,158
Interest Rate
4.5%
Mortgage Type
FHA
Estimated Equity
$181,401
Purchase Details
Closed on
Feb 15, 2012
Sold by
Flesch William J
Bought by
Flesch Shanyn L
Purchase Details
Closed on
Nov 11, 2005
Sold by
Frederick Brian R and Frederick Karen J
Bought by
Moorehead Christopher C and Moorehead Tanya
Home Financials for this Owner
Home Financials are based on the most recent Mortgage that was taken out on this home.
Original Mortgage
$123,920
Interest Rate
6.04%
Mortgage Type
Fannie Mae Freddie Mac
Create a Home Valuation Report for This Property
The Home Valuation Report is an in-depth analysis detailing your home's value as well as a comparison with similar homes in the area
Home Values in the Area
Average Home Value in this Area
Purchase History
| Date | Buyer | Sale Price | Title Company |
|---|---|---|---|
| Thomas Jessica | $108,000 | True Title Agency Inc | |
| Flesch Shanyn L | -- | Attorney | |
| Moorehead Christopher C | $154,900 | Real Living Title Agency Ltd |
Source: Public Records
Mortgage History
| Date | Status | Borrower | Loan Amount |
|---|---|---|---|
| Open | Thomas Jessica | $106,043 | |
| Previous Owner | Moorehead Christopher C | $123,920 |
Source: Public Records
Tax History Compared to Growth
Tax History
| Year | Tax Paid | Tax Assessment Tax Assessment Total Assessment is a certain percentage of the fair market value that is determined by local assessors to be the total taxable value of land and additions on the property. | Land | Improvement |
|---|---|---|---|---|
| 2024 | $2,952 | $73,108 | $13,976 | $59,133 |
| 2023 | $2,530 | $52,815 | $11,802 | $41,013 |
| 2022 | $2,426 | $52,815 | $11,802 | $41,013 |
| 2021 | $2,432 | $52,815 | $11,802 | $41,013 |
| 2020 | $2,266 | $43,680 | $9,760 | $33,920 |
| 2019 | $2,221 | $43,680 | $9,760 | $33,920 |
| 2018 | $2,177 | $43,680 | $9,760 | $33,920 |
| 2017 | $2,122 | $38,980 | $8,040 | $30,940 |
| 2016 | $2,139 | $38,980 | $8,040 | $30,940 |
| 2015 | $2,127 | $38,980 | $8,040 | $30,940 |
| 2014 | $2,231 | $40,700 | $8,400 | $32,300 |
| 2013 | $2,239 | $40,700 | $8,400 | $32,300 |
Source: Public Records
Map
Nearby Homes
- 0 Cooper Foster Park Rd Unit 5129838
- 922 Sharondale Dr
- 1011 N Main St
- 3489 Coopers Trail
- 117 Fall Lake Ln
- 707 Greenlawn Dr
- 110 Habant Dr
- 1250 N Main St
- 1273 Spruce Tree Ln
- 4872 Leavitt Rd
- 726 Sunrise Dr
- 357 Pebble Creek Ct
- Poplar Plan at Quarry Creek
- Pine w/ Full Basement Plan at Quarry Creek
- 369 Pebble Creek Ct
- 0 Rosecliff Dr
- 60 Flamingo Ave
- 127 Tropicana Ave
- 105 N Woodhill Dr
- 117 Caesars Cir
- 1013 Terra Ln
- 1053 Terra Ln
- 835 Columbia Dr
- 1073 Terra Ln
- 855 Columbia Dr
- 858 Cooper Foster Park Rd
- 830 Columbia Dr
- 834 Columbia Dr
- 868 Cooper Foster Park Rd
- 875 Columbia Dr
- 985 Terra Ln
- 878 Cooper Foster Park Rd
- 986 Princeton Ave
- 895 Columbia Dr
- 971 Terra Ln
- 894 Columbia Dr
- 888 Cooper Foster Park Rd
- 972 Princeton Ave
- 0 Cooper Foster Park Rd Unit 3013440
- VL Cooper Foster Park Rd