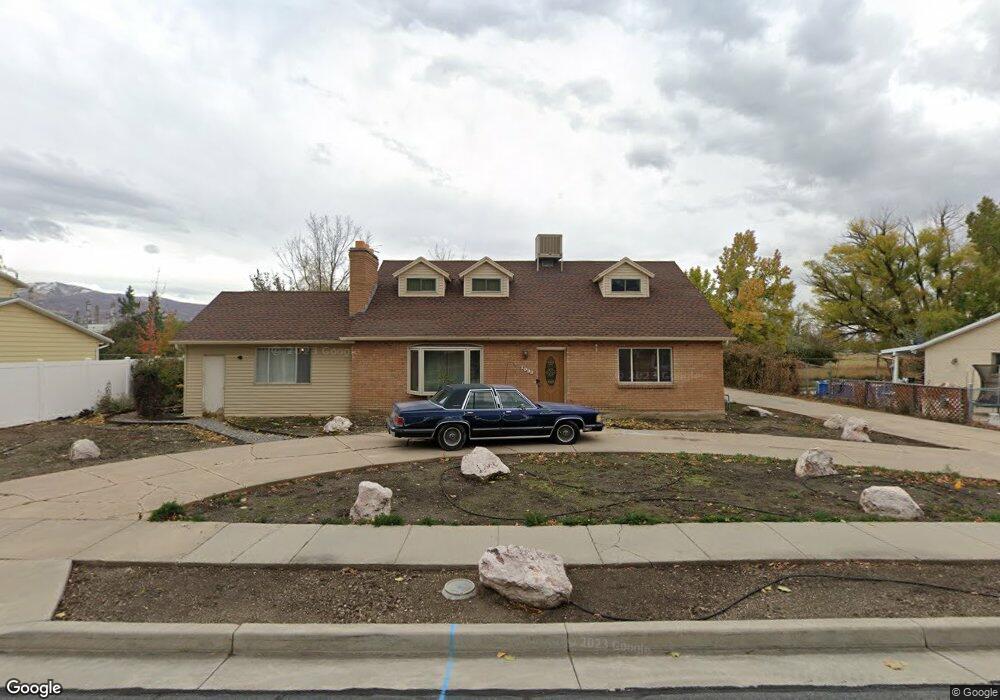
1033 W 200 N West Bountiful, UT 84087
Estimated Value: $533,549 - $1,040,000
4
Beds
2
Baths
2,336
Sq Ft
$302/Sq Ft
Est. Value
About This Home
This home is located at 1033 W 200 N, West Bountiful, UT 84087 and is currently estimated at $706,137, approximately $302 per square foot. 1033 W 200 N is a home located in Davis County with nearby schools including West Bountiful Elementary School, Bountiful Junior High School, and Viewmont High School.
Ownership History
Date
Name
Owned For
Owner Type
Purchase Details
Closed on
Dec 14, 2021
Sold by
Hansen Maren
Bought by
Hansen Maren and The Maren Hansen Living Trust
Current Estimated Value
Purchase Details
Closed on
May 15, 2007
Sold by
Grimshaw Jannette V and Cleverly Jannette V
Bought by
Grimshaw Jannette
Home Financials for this Owner
Home Financials are based on the most recent Mortgage that was taken out on this home.
Original Mortgage
$20,000
Interest Rate
6.18%
Mortgage Type
Credit Line Revolving
Purchase Details
Closed on
Apr 2, 2003
Sold by
Cleverly Alan M and Cleverly Jannette V
Bought by
Cleverly Jannette
Home Financials for this Owner
Home Financials are based on the most recent Mortgage that was taken out on this home.
Original Mortgage
$110,000
Interest Rate
5.04%
Mortgage Type
Purchase Money Mortgage
Purchase Details
Closed on
Apr 23, 1999
Sold by
Cleverly Alan M and Cleverly Jannette V
Bought by
Cleverly Alan M
Create a Home Valuation Report for This Property
The Home Valuation Report is an in-depth analysis detailing your home's value as well as a comparison with similar homes in the area
Home Values in the Area
Average Home Value in this Area
Purchase History
| Date | Buyer | Sale Price | Title Company |
|---|---|---|---|
| Hansen Maren | -- | None Available | |
| Grimshaw Jannette | -- | First American Title | |
| Cleverly Jannette | -- | Backman Stewart Title Servic | |
| Cleverly Alan M | -- | Backman Stewart Title Servic | |
| Cleverly Alan M | -- | -- |
Source: Public Records
Mortgage History
| Date | Status | Borrower | Loan Amount |
|---|---|---|---|
| Closed | Grimshaw Jannette | $20,000 | |
| Closed | Cleverly Jannette | $110,000 |
Source: Public Records
Tax History Compared to Growth
Tax History
| Year | Tax Paid | Tax Assessment Tax Assessment Total Assessment is a certain percentage of the fair market value that is determined by local assessors to be the total taxable value of land and additions on the property. | Land | Improvement |
|---|---|---|---|---|
| 2025 | $571 | $264,550 | $135,965 | $128,585 |
| 2024 | $571 | $255,750 | $111,696 | $144,054 |
| 2023 | $3,039 | $500,000 | $212,097 | $287,903 |
| 2022 | $3,009 | $276,650 | $101,103 | $175,547 |
| 2021 | $2,616 | $368,000 | $135,232 | $232,768 |
| 2020 | $2,324 | $323,000 | $126,384 | $196,616 |
| 2019 | $2,289 | $315,000 | $128,247 | $186,753 |
| 2018 | $2,167 | $294,000 | $129,562 | $164,438 |
| 2016 | $1,871 | $137,720 | $32,903 | $104,817 |
| 2015 | $1,819 | $127,270 | $32,903 | $94,367 |
| 2014 | $1,837 | $132,306 | $32,621 | $99,685 |
| 2013 | -- | $110,942 | $28,676 | $82,266 |
Source: Public Records
Map
Nearby Homes
- 280 N 1100 W
- 767 W 220 N
- 680 W 500 S Unit 22
- 680 W 500 S Unit 17
- 1067 W Audrey Ln Unit 8
- 1075 W Audrey Ln Unit 6
- Carson Plan at Amberly Place
- 2050 Farmhouse Plan at Amberly Place
- Pasadena (Inactive) Plan at Amberly Place
- Portland Plan at Amberly Place
- 1056 W Audrey Ln Unit 14
- 1064 W Audrey Ln Unit 15
- 1072 W Audrey Ln Unit 17
- 1069 W Linden Ln Unit 31
- 825 W 1320 N
- 340 N 500 W Unit 204
- 758 W 1000 S
- 743 W 1000 S
- 399 W 400 N Unit 47
- 1288 S 1050 W