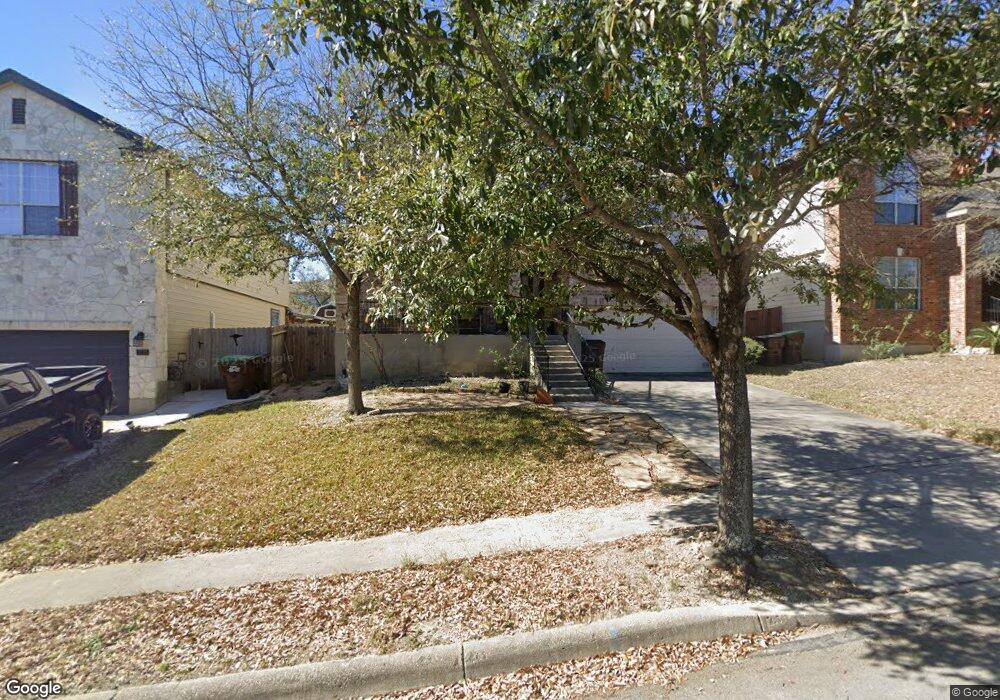
10330 Risen Bay San Antonio, TX 78254
Estimated Value: $327,965 - $374,000
4
Beds
3
Baths
2,519
Sq Ft
$140/Sq Ft
Est. Value
About This Home
This home is located at 10330 Risen Bay, San Antonio, TX 78254 and is currently estimated at $351,491, approximately $139 per square foot. 10330 Risen Bay is a home located in Bexar County with nearby schools including Krueger Elementary School, Jefferson Middle School, and School of Science and Technology Hill Country.
Ownership History
Date
Name
Owned For
Owner Type
Purchase Details
Closed on
Aug 8, 2014
Sold by
Auge Christopher Scott
Bought by
Auge Veronica Silva
Current Estimated Value
Home Financials for this Owner
Home Financials are based on the most recent Mortgage that was taken out on this home.
Original Mortgage
$148,400
Outstanding Balance
$113,366
Interest Rate
4.16%
Mortgage Type
VA
Estimated Equity
$238,125
Purchase Details
Closed on
Jul 5, 2006
Sold by
Continental Homes Of Texas Lp
Bought by
Auge Christopher S and Auge Veronica S
Home Financials for this Owner
Home Financials are based on the most recent Mortgage that was taken out on this home.
Original Mortgage
$181,764
Interest Rate
6.6%
Mortgage Type
VA
Create a Home Valuation Report for This Property
The Home Valuation Report is an in-depth analysis detailing your home's value as well as a comparison with similar homes in the area
Home Values in the Area
Average Home Value in this Area
Purchase History
| Date | Buyer | Sale Price | Title Company |
|---|---|---|---|
| Auge Veronica Silva | -- | Rbtc | |
| Auge Christopher S | -- | Dhi Title |
Source: Public Records
Mortgage History
| Date | Status | Borrower | Loan Amount |
|---|---|---|---|
| Open | Auge Veronica Silva | $148,400 | |
| Closed | Auge Christopher S | $181,764 |
Source: Public Records
Tax History Compared to Growth
Tax History
| Year | Tax Paid | Tax Assessment Tax Assessment Total Assessment is a certain percentage of the fair market value that is determined by local assessors to be the total taxable value of land and additions on the property. | Land | Improvement |
|---|---|---|---|---|
| 2025 | $4,615 | $333,620 | $55,900 | $277,720 |
| 2024 | $4,615 | $336,960 | $55,900 | $281,060 |
| 2023 | $4,615 | $307,074 | $55,900 | $288,180 |
| 2022 | $5,670 | $279,158 | $46,600 | $276,910 |
| 2021 | $5,343 | $253,780 | $42,370 | $211,410 |
| 2020 | $5,235 | $243,420 | $42,370 | $201,050 |
| 2019 | $5,263 | $237,010 | $33,690 | $203,320 |
| 2018 | $4,936 | $222,110 | $33,690 | $188,420 |
| 2017 | $4,791 | $215,130 | $33,690 | $181,440 |
| 2016 | $4,660 | $209,260 | $33,690 | $175,570 |
| 2015 | $3,855 | $198,630 | $33,690 | $164,940 |
| 2014 | $3,855 | $186,410 | $0 | $0 |
Source: Public Records
Map
Nearby Homes
- 10225 Braun Rd Unit A201
- 10225 Braun Rd Unit A310
- 10225 Braun Rd Unit C601
- 10225 Braun Rd Unit A302
- 10225 Braun Rd Unit A309
- 10523 Timber Country
- 10322 Alsfeld Ranch
- 10418 Alsfeld Ranch
- 10322 Filly Valley
- 10231 Roseangel Ln
- 9950 Sandlet Trail
- 9951 Sandlet Trail
- 11030 Chicory Field
- 10223 Huisache Field
- 9807 Sandlet Trail
- 9607 Country Shadow
- 10607 Tansy Canyon
- 10707 Pharaoh Run
- 10706 Pharaoh Run
- 10714 Cactus Way
- 10326 Risen Bay
- 10334 Risen Bay
- 10322 Risen Bay
- 10338 Risen Bay
- 10331 Trotters Bay
- 10327 Trotters Bay
- 10335 Trotters Bay
- 10339 Trotters Bay
- 10323 Trotters Bay
- 10318 Risen Bay
- 10342 Risen Bay
- 10331 Risen Bay
- 10327 Risen Bay
- 10335 Risen Bay
- 10323 Risen Bay
- 10319 Trotters Bay
- 10343 Trotters Bay
- 10339 Risen Bay
- 10314 Risen Bay
- 10319 Risen Bay