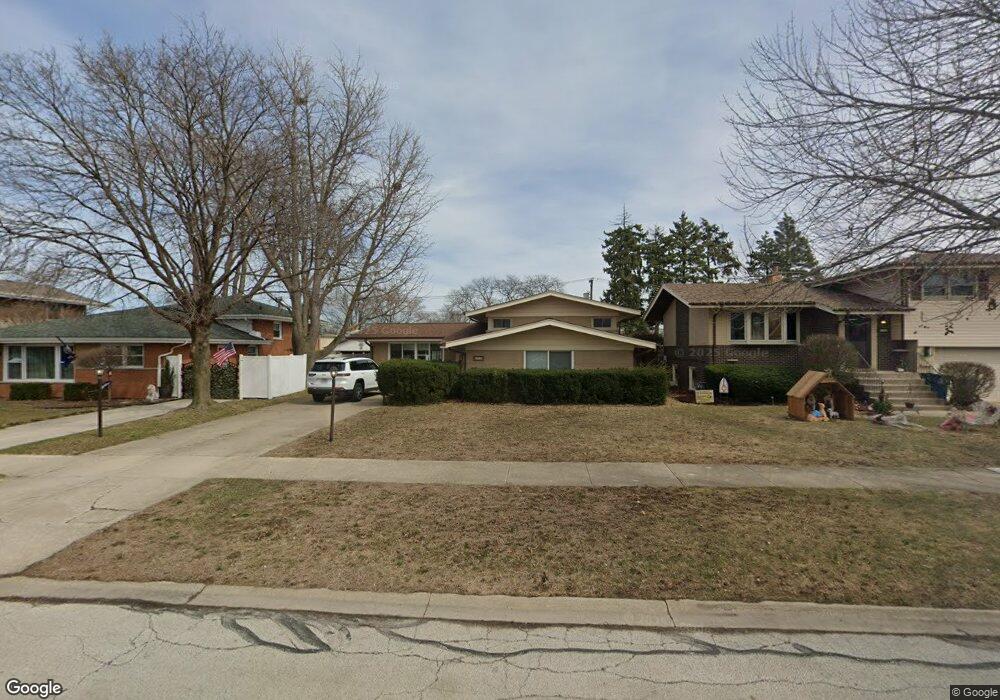
10333 Long Ave Oak Lawn, IL 60453
Estimated Value: $337,000 - $379,000
3
Beds
2
Baths
1,309
Sq Ft
$268/Sq Ft
Est. Value
About This Home
This home is located at 10333 Long Ave, Oak Lawn, IL 60453 and is currently estimated at $350,221, approximately $267 per square foot. 10333 Long Ave is a home located in Cook County with nearby schools including Kolmar Avenue Elementary School, Sward Elementary School, and J Covington Elementary School.
Ownership History
Date
Name
Owned For
Owner Type
Purchase Details
Closed on
Apr 1, 2022
Sold by
Noreen P Hosty Trust and Hosty Patrick S
Bought by
Hosty Patrick D
Current Estimated Value
Home Financials for this Owner
Home Financials are based on the most recent Mortgage that was taken out on this home.
Original Mortgage
$261,250
Outstanding Balance
$244,420
Interest Rate
3.88%
Mortgage Type
New Conventional
Estimated Equity
$105,801
Purchase Details
Closed on
Aug 8, 2019
Sold by
Hosty Noreen P
Bought by
Hosty Patrick S and Noreen P Hosty Trust
Purchase Details
Closed on
Aug 13, 1997
Sold by
First National Bank Of Evergreen Park
Bought by
Hosty Peter J and Hosty Noreen P
Home Financials for this Owner
Home Financials are based on the most recent Mortgage that was taken out on this home.
Original Mortgage
$66,250
Interest Rate
7.56%
Create a Home Valuation Report for This Property
The Home Valuation Report is an in-depth analysis detailing your home's value as well as a comparison with similar homes in the area
Home Values in the Area
Average Home Value in this Area
Purchase History
| Date | Buyer | Sale Price | Title Company |
|---|---|---|---|
| Hosty Patrick D | $275,000 | First American Title | |
| Hosty Patrick S | -- | Attorney | |
| Hosty Peter J | $111,333 | Intercounty Title |
Source: Public Records
Mortgage History
| Date | Status | Borrower | Loan Amount |
|---|---|---|---|
| Open | Hosty Patrick D | $261,250 | |
| Previous Owner | Hosty Peter J | $66,250 |
Source: Public Records
Tax History Compared to Growth
Tax History
| Year | Tax Paid | Tax Assessment Tax Assessment Total Assessment is a certain percentage of the fair market value that is determined by local assessors to be the total taxable value of land and additions on the property. | Land | Improvement |
|---|---|---|---|---|
| 2024 | $7,931 | $28,001 | $5,528 | $22,473 |
| 2023 | $7,730 | $28,001 | $5,528 | $22,473 |
| 2022 | $7,730 | $19,609 | $4,791 | $14,818 |
| 2021 | $7,523 | $19,608 | $4,790 | $14,818 |
| 2020 | $8,112 | $21,355 | $4,790 | $16,565 |
| 2019 | $3,792 | $19,606 | $4,422 | $15,184 |
| 2018 | $3,657 | $19,606 | $4,422 | $15,184 |
| 2017 | $3,638 | $21,491 | $4,422 | $17,069 |
| 2016 | $4,862 | $16,710 | $3,685 | $13,025 |
| 2015 | $4,707 | $16,710 | $3,685 | $13,025 |
| 2014 | $5,389 | $18,589 | $3,685 | $14,904 |
| 2013 | $5,551 | $20,695 | $3,685 | $17,010 |
Source: Public Records
Map
Nearby Homes
- 5300 Oakdale Dr
- 10230 Washington Ave Unit 1D
- 5549 W 102nd St
- 10420 Washington Ave
- 10241 S Central Ave Unit 1B
- 10210 Washington Ave Unit 311
- 10210 Washington Ave Unit 305
- 10540 Lockwood Ave
- 5509 Oak Center Dr
- 10355 Parkside Ave Unit 4
- 10309 Parkside Ave
- 5621 W 104th St Unit B2
- 5125 W 101st St
- 5630 W 103rd St Unit 308
- 10364 Parkside Ave Unit C1
- 5120 W 101st St
- 10021 Cook Ave
- 10538 Central Ave Unit 3S
- 10308 Circle Dr Unit 301
- 10510 Parkside Ave Unit 7
- 10329 Long Ave
- 10337 Long Ave
- 10325 Long Ave
- 10341 Long Ave
- 10332 Minnick Ave
- 10328 Minnick Ave
- 10336 Minnick Ave
- 10321 Long Ave
- 10324 Minnick Ave
- 10340 Minnick Ave
- 10401 Long Ave
- 10332 Long Ave
- 10328 Long Ave
- 10320 Minnick Ave
- 10336 Long Ave
- 10324 Long Ave
- 10317 Long Ave
- 10340 Long Ave
- 10320 Long Ave
- 10405 Long Ave