Estimated Value: $254,000 - $305,937
3
Beds
3
Baths
1,890
Sq Ft
$152/Sq Ft
Est. Value
About This Home
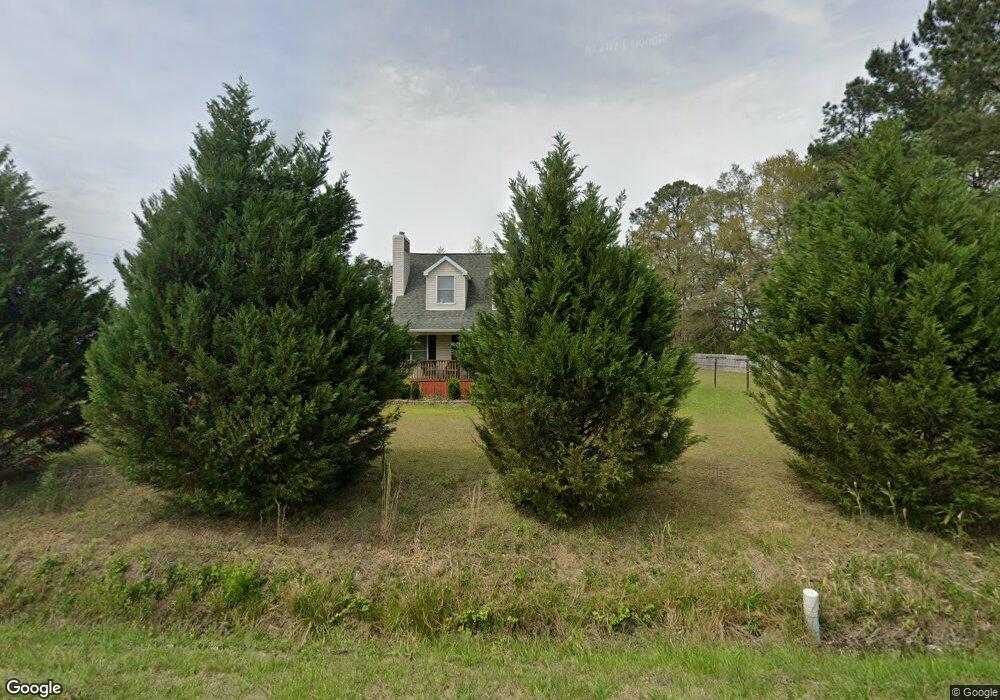
This home is located at 10333 S Highway 905, Longs, SC 29568 and is currently estimated at $287,984, approximately $152 per square foot. 10333 S Highway 905 is a home located in Horry County with nearby schools including Daisy Elementary School, Loris Middle School, and Loris High School.
Ownership History
Date
Name
Owned For
Owner Type
Purchase Details
Closed on
Jan 6, 2022
Sold by
Swimm David A
Bought by
Swimm David Arthur
Current Estimated Value
Purchase Details
Closed on
Apr 20, 2010
Sold by
Emerson Bay Llc
Bought by
Swimm David A
Purchase Details
Closed on
Jan 29, 2010
Sold by
Master In Equity Horry County
Bought by
Emerson Bay Llc
Purchase Details
Closed on
Aug 2, 2005
Sold by
Countrywide Home Loans Inc
Bought by
Downer Thomas Earl and Downer Kathy Marie
Purchase Details
Closed on
Jun 14, 2005
Sold by
Matheson Ted B and Mortgage Electronic Registrati
Bought by
Countrywide Home Loans Inc and Banc Of America Mortgage Capital Corp
Purchase Details
Closed on
Jul 25, 2003
Sold by
Leppard Chad
Bought by
Matheson Ted B
Purchase Details
Closed on
Jul 24, 2003
Sold by
Leppard Patricia J and Jpc Development
Bought by
Leppard Chad
Purchase Details
Closed on
Dec 20, 2002
Sold by
Skipper Alva Jane
Bought by
Leppard Patricia J and Jpc Development
Create a Home Valuation Report for This Property
The Home Valuation Report is an in-depth analysis detailing your home's value as well as a comparison with similar homes in the area
Home Values in the Area
Average Home Value in this Area
Purchase History
| Date | Buyer | Sale Price | Title Company |
|---|---|---|---|
| Swimm David Arthur | -- | -- | |
| Swimm David A | $134,000 | -- | |
| Emerson Bay Llc | $92,501 | -- | |
| Downer Thomas Earl | $135,000 | -- | |
| Countrywide Home Loans Inc | $70,000 | -- | |
| Matheson Ted B | $34,800 | -- | |
| Leppard Chad | -- | -- | |
| Leppard Patricia J | $90,000 | -- |
Source: Public Records
Tax History Compared to Growth
Tax History
| Year | Tax Paid | Tax Assessment Tax Assessment Total Assessment is a certain percentage of the fair market value that is determined by local assessors to be the total taxable value of land and additions on the property. | Land | Improvement |
|---|---|---|---|---|
| 2024 | -- | $11,601 | $2,786 | $8,815 |
| 2023 | $0 | $10,504 | $864 | $9,640 |
| 2021 | $741 | $10,836 | $1,032 | $9,804 |
| 2020 | $2,198 | $10,836 | $1,032 | $9,804 |
| 2019 | $2,198 | $11,526 | $1,032 | $10,494 |
| 2018 | $1,986 | $9,134 | $746 | $8,388 |
| 2017 | $1,971 | $9,134 | $746 | $8,388 |
| 2016 | -- | $9,134 | $746 | $8,388 |
| 2015 | $1,971 | $9,134 | $746 | $8,388 |
| 2014 | $1,906 | $9,134 | $746 | $8,388 |
Source: Public Records
Map
Nearby Homes
- 321 Boxcar Dr
- 209 Rail St
- 401 Quinta St
- 210 Rail St
- 378 Hillwood Ct
- 517 Mossbank Loop
- 252 Red Maple Loop
- 251 Red Maple Loop
- 509 Covewood Ct
- 1146 Joywood Dr
- 568 Mossbank Loop
- 12264 S Carolina 905 Unit N Highway 905
- 267 Lakota Loop
- 304 Mistletoe Way
- 304 Mistletoe Way Unit Lot 5
- Whitetail Plan at Birchwood
- Woodhaven Plan at Birchwood
- Gerson Plan at Birchwood
- Brower Plan at Birchwood
- Lookout Plan at Birchwood
- 10327 S Highway 905
- 10321 S Highway 905
- 10372 S Highway 905
- 10322 S Highway 905
- 10385 S Highway 905
- 10374 S Highway 905
- 10315 S Highway 905
- 10376 S Hwy 905
- 10376 S Highway 905
- 10378 S Highway 905
- 301 Boxcar Dr
- 305 Boxcar Dr Unit Longs Station
- 305 Boxcar Dr
- 10380 S Highway 905
- 300 Boxcar Dr
- 309 Boxcar Dr
- 10384 S Highway 905
- 10287 S Highway 905
- 177 Cypress Tree Loop Unit Lot 29- Dover B
- 181 Cypress Tree Loop