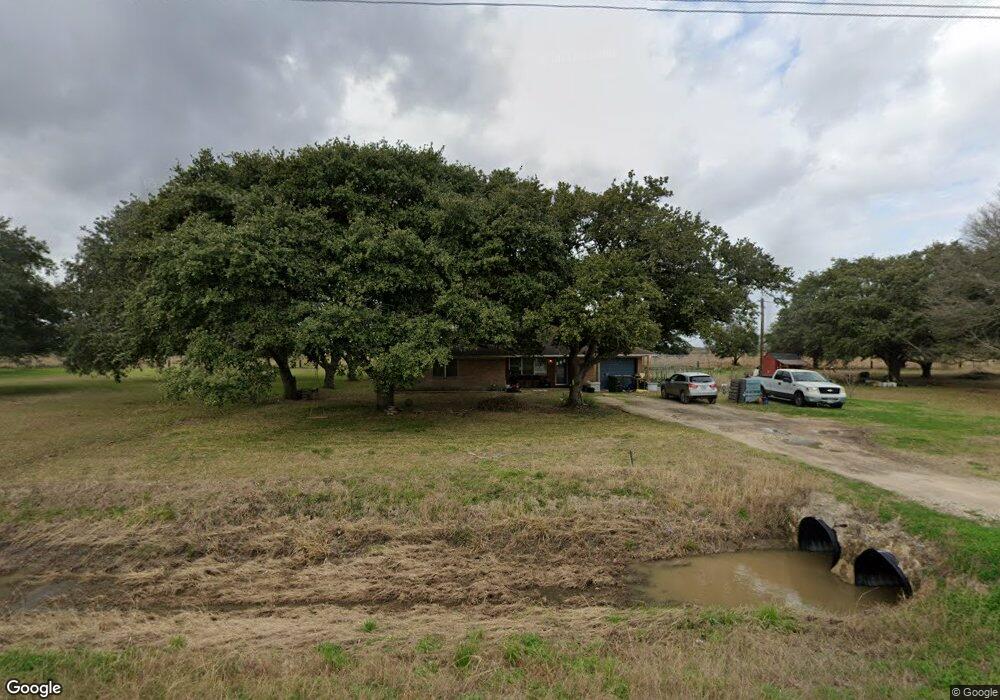
10338 Williams School Rd Needville, TX 77461
Estimated Value: $309,198 - $511,000
3
Beds
1
Bath
1,504
Sq Ft
$257/Sq Ft
Est. Value
About This Home
This home is located at 10338 Williams School Rd, Needville, TX 77461 and is currently estimated at $387,050, approximately $257 per square foot. 10338 Williams School Rd is a home located in Fort Bend County with nearby schools including Needville Elementary School, Needville Junior High School, and Needville Middle School.
Ownership History
Date
Name
Owned For
Owner Type
Purchase Details
Closed on
Dec 27, 2016
Sold by
Vincik Shawn and Vincik Melissa
Bought by
Huttenhoff Joseph and Huttenhoff Danielle J
Current Estimated Value
Home Financials for this Owner
Home Financials are based on the most recent Mortgage that was taken out on this home.
Original Mortgage
$144,000
Outstanding Balance
$118,533
Interest Rate
4.08%
Mortgage Type
New Conventional
Estimated Equity
$268,517
Purchase Details
Closed on
May 7, 2008
Sold by
Legendre Clinton and Legendre Danita
Bought by
Vincik Shawn and Vincik Melissa
Home Financials for this Owner
Home Financials are based on the most recent Mortgage that was taken out on this home.
Original Mortgage
$137,025
Interest Rate
6.08%
Mortgage Type
Purchase Money Mortgage
Create a Home Valuation Report for This Property
The Home Valuation Report is an in-depth analysis detailing your home's value as well as a comparison with similar homes in the area
Home Values in the Area
Average Home Value in this Area
Purchase History
| Date | Buyer | Sale Price | Title Company |
|---|---|---|---|
| Huttenhoff Joseph | -- | Stewart Title | |
| Vincik Shawn | -- | Startex Title Company | |
| Huttenhoff Joseph | -- | -- |
Source: Public Records
Mortgage History
| Date | Status | Borrower | Loan Amount |
|---|---|---|---|
| Open | Huttenhoff Joseph | $144,000 | |
| Previous Owner | Huttenhoff Joseph | $137,025 |
Source: Public Records
Tax History Compared to Growth
Tax History
| Year | Tax Paid | Tax Assessment Tax Assessment Total Assessment is a certain percentage of the fair market value that is determined by local assessors to be the total taxable value of land and additions on the property. | Land | Improvement |
|---|---|---|---|---|
| 2025 | $3,526 | $254,131 | $102,500 | $151,631 |
| 2024 | $3,526 | $259,908 | $92,403 | $167,505 |
| 2023 | $3,110 | $236,280 | $68,667 | $167,613 |
| 2022 | $3,529 | $214,800 | $62,400 | $152,400 |
| 2021 | $3,702 | $195,270 | $68,850 | $126,420 |
| 2020 | $3,895 | $192,680 | $68,850 | $123,830 |
| 2019 | $3,761 | $175,160 | $56,200 | $118,960 |
| 2018 | $3,415 | $159,240 | $38,650 | $120,590 |
| 2017 | $3,368 | $156,570 | $40,000 | $116,570 |
| 2016 | $3,344 | $155,450 | $34,700 | $120,750 |
| 2015 | $2,816 | $153,410 | $36,610 | $116,800 |
| 2014 | $2,720 | $139,460 | $36,610 | $102,850 |
Source: Public Records
Map
Nearby Homes
- 10708 Creek Bend Dr
- 8214 Noble St
- 9211 E Creek Bend Dr
- 7810 Church St
- 12122 Mueck Rd
- 9218 E Creek Bend Dr
- 8422 W 1st St
- 8026 Main St
- 3635 Needville Ave
- TBD W 1st St
- 0 Tolbert St Unit 36647147
- 3418 Schroeder Ave
- 8813 Altimore Rd
- 8915 W Richmond St
- TBD01 Mueck Rd
- 8912 Park St
- 8903 Milby St
- 8231 Main St
- 13911 W Richmond St
- 10630 Brinkmeyer Rd
- 10426 Williams School Rd
- 6410 Meyer Rd
- 6150 Meyer Rd
- 6819 Schmidt Rd
- 10702 Williams School Rd
- 7119 Schmidt Rd
- 7203 Schmidt Rd
- 7203 Schmidt Rd
- 7203 Schmidt Rd
- 11010 Williams School Rd
- 7209 Schmidt Rd
- 11030 Williams School Rd
- 6806 Schmidt Rd
- 11110 Williams School Rd
- 11210 Williams School Rd
- 11318 Williams School Rd
- 10227 Boone Rd
- Tract A Boone Rd