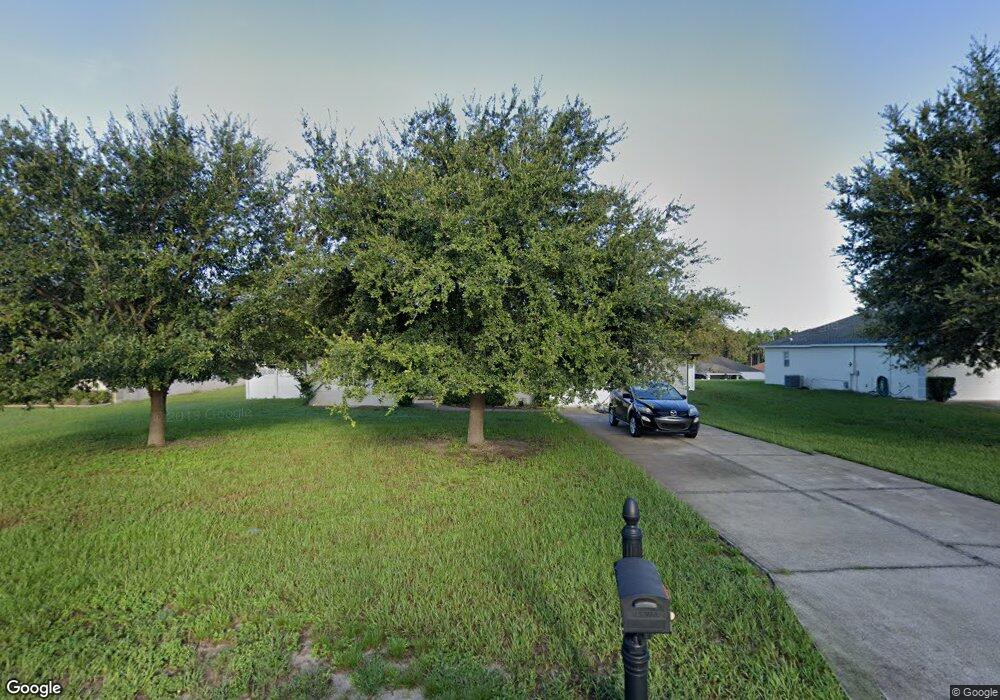
10339 Vista Pines Loop Clermont, FL 34711
Estimated Value: $338,000 - $579,000
3
Beds
2
Baths
2,034
Sq Ft
$210/Sq Ft
Est. Value
About This Home
This home is located at 10339 Vista Pines Loop, Clermont, FL 34711 and is currently estimated at $426,875, approximately $209 per square foot. 10339 Vista Pines Loop is a home located in Lake County with nearby schools including Pine Ridge Elementary School, Gray Middle School, and South Lake High School.
Ownership History
Date
Name
Owned For
Owner Type
Purchase Details
Closed on
Sep 30, 2011
Sold by
Rigsby Douglas W and Rigsby Lydia D
Bought by
Sher Roger and Appleby Sher Kimberly D
Current Estimated Value
Home Financials for this Owner
Home Financials are based on the most recent Mortgage that was taken out on this home.
Original Mortgage
$105,600
Outstanding Balance
$72,051
Interest Rate
4.26%
Mortgage Type
New Conventional
Estimated Equity
$354,824
Purchase Details
Closed on
May 9, 2005
Sold by
Highland Homes Of Clermont Inc
Bought by
Rigsby Douglas W and Rigsby Lydia D
Home Financials for this Owner
Home Financials are based on the most recent Mortgage that was taken out on this home.
Original Mortgage
$212,922
Interest Rate
5.88%
Mortgage Type
VA
Purchase Details
Closed on
Nov 2, 2004
Sold by
Ladd Development Inc
Bought by
Highland Homes Of Clermont Inc
Create a Home Valuation Report for This Property
The Home Valuation Report is an in-depth analysis detailing your home's value as well as a comparison with similar homes in the area
Home Values in the Area
Average Home Value in this Area
Purchase History
| Date | Buyer | Sale Price | Title Company |
|---|---|---|---|
| Sher Roger | $132,000 | Attorney | |
| Rigsby Douglas W | $213,000 | South Lake Title Svcs Inc | |
| Highland Homes Of Clermont Inc | $200,000 | South Lake Title Svcs Inc |
Source: Public Records
Mortgage History
| Date | Status | Borrower | Loan Amount |
|---|---|---|---|
| Open | Sher Roger | $105,600 | |
| Previous Owner | Rigsby Douglas W | $212,922 |
Source: Public Records
Tax History Compared to Growth
Tax History
| Year | Tax Paid | Tax Assessment Tax Assessment Total Assessment is a certain percentage of the fair market value that is determined by local assessors to be the total taxable value of land and additions on the property. | Land | Improvement |
|---|---|---|---|---|
| 2026 | $4,811 | $342,136 | $90,000 | $252,136 |
| 2025 | $4,527 | $307,643 | $56,100 | $251,543 |
| 2024 | $4,527 | $307,643 | $56,100 | $251,543 |
| 2023 | $4,527 | $300,381 | $56,100 | $244,281 |
| 2022 | $4,204 | $300,281 | $56,100 | $244,181 |
| 2021 | $3,773 | $244,537 | $0 | $0 |
| 2020 | $3,617 | $231,486 | $0 | $0 |
| 2019 | $3,489 | $209,379 | $0 | $0 |
| 2018 | $3,348 | $204,213 | $0 | $0 |
| 2017 | $3,076 | $186,935 | $0 | $0 |
| 2016 | $2,999 | $177,396 | $0 | $0 |
| 2015 | $2,963 | $168,664 | $0 | $0 |
| 2014 | $2,863 | $160,268 | $0 | $0 |
Source: Public Records
Map
Nearby Homes
- 0 Lot 3 Mercado Ct Unit MFRO6285060
- 0 Pine Island Rd Unit MFRO6309954
- 10219 Lenox St
- Lot 2 Mercado Ct
- 0 Old Grove Rd
- 10259 Lenox St
- 9065 Oakheart Ln
- 9652 Oakheart Ln
- 0 Palmento Way Unit MFRO6279182
- 0 Priebe Rd
- 10112 Yonaomi Cir
- 10816 Wyandotte Dr
- 10830 Vineyard Ct
- 10414 Mesa Ln
- 9835 Lakeshore Dr
- 0 Crescent Lake Ct Unit MFRG5100684
- 10662 Lake Hill Dr
- 10732 Porter Trail
- 11110 Oleander Dr
- Peterson Cove Plan at Lake Nellie Crossing
- 10343 Vista Pines Loop
- 10333 Vista Pines Loop
- 10453 Vista Pines Loop
- 10453 Loop
- 10501 Vista Pines Loop
- 10449 Vista Pines Loop
- 10336 Vista Pines Loop
- 10445 Vista Pines Loop
- 10505 Vista Pines Loop
- 10344 Vista Pines Loop
- 10332 Vista Pines Loop
- 10401 Vista Pines Loop
- 10325 Vista Pines Loop
- 10348 Vista Pines Loop
- 10441 Vista Pines Loop
- 10509 Vista Pines Loop
- 10328 Vista Pines Loop
- 10402 Vista Pines Loop
- Lot 4 Mercado Ct