Estimated Value: $258,000 - $278,000
2
Beds
4
Baths
1,456
Sq Ft
$184/Sq Ft
Est. Value
About This Home
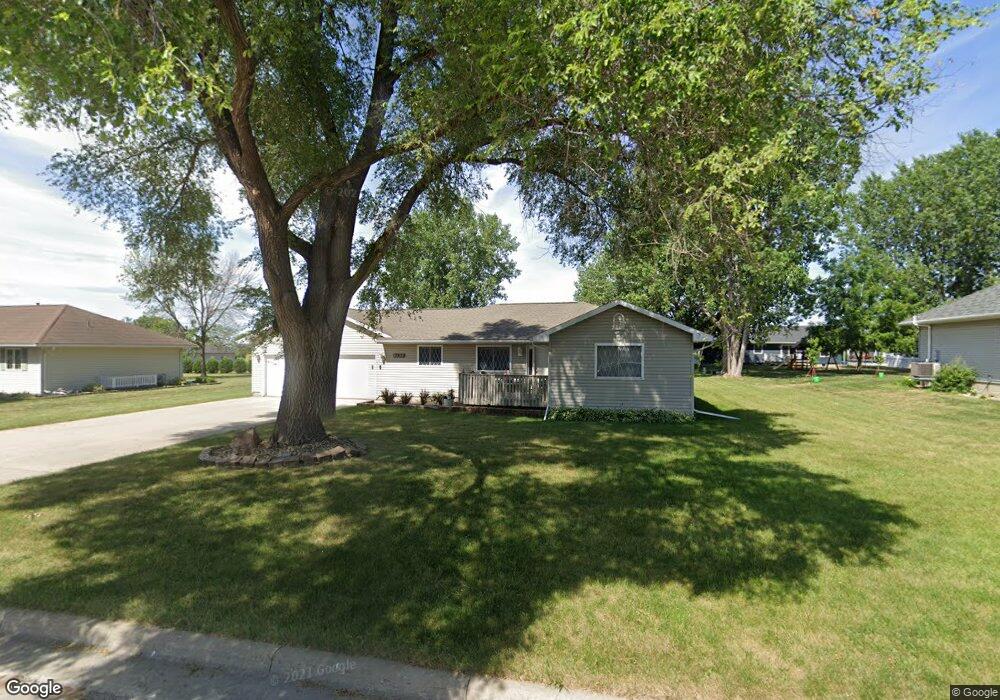
This home is located at 1034 3rd St, Jesup, IA 50648 and is currently estimated at $267,904, approximately $184 per square foot. 1034 3rd St is a home located in Buchanan County with nearby schools including Jesup Elementary School, Jesup Middle School, and Jesup High School.
Ownership History
Date
Name
Owned For
Owner Type
Purchase Details
Closed on
May 27, 2005
Sold by
Ramsey David M and Ramsey Keri L
Bought by
Novak Billy J and Novak Sonja J
Current Estimated Value
Home Financials for this Owner
Home Financials are based on the most recent Mortgage that was taken out on this home.
Original Mortgage
$119,920
Outstanding Balance
$66,541
Interest Rate
6.75%
Mortgage Type
Adjustable Rate Mortgage/ARM
Estimated Equity
$201,363
Create a Home Valuation Report for This Property
The Home Valuation Report is an in-depth analysis detailing your home's value as well as a comparison with similar homes in the area
Home Values in the Area
Average Home Value in this Area
Purchase History
| Date | Buyer | Sale Price | Title Company |
|---|---|---|---|
| Novak Billy J | $150,000 | None Available |
Source: Public Records
Mortgage History
| Date | Status | Borrower | Loan Amount |
|---|---|---|---|
| Open | Novak Billy J | $119,920 |
Source: Public Records
Tax History
| Year | Tax Paid | Tax Assessment Tax Assessment Total Assessment is a certain percentage of the fair market value that is determined by local assessors to be the total taxable value of land and additions on the property. | Land | Improvement |
|---|---|---|---|---|
| 2025 | $4,150 | $266,250 | $38,370 | $227,880 |
| 2024 | $4,150 | $237,070 | $34,260 | $202,810 |
| 2023 | $4,026 | $237,070 | $34,260 | $202,810 |
| 2022 | $3,850 | $198,700 | $27,190 | $171,510 |
| 2021 | $3,798 | $198,700 | $27,190 | $171,510 |
| 2020 | $3,798 | $185,250 | $24,930 | $160,320 |
| 2019 | $3,688 | $185,250 | $24,930 | $160,320 |
| 2018 | $3,496 | $179,440 | $24,930 | $154,510 |
| 2017 | $3,470 | $179,440 | $24,930 | $154,510 |
| 2016 | $3,386 | $174,990 | $16,850 | $158,140 |
| 2015 | $3,386 | $174,990 | $16,850 | $158,140 |
| 2014 | $3,442 | $174,990 | $16,850 | $158,140 |
Source: Public Records
Map
Nearby Homes
- 1124 3rd St
- 1225 1st St
- 1634 Dalton St
- 524 Christopher Cir
- 235 Bordner Dr
- 435 5th St
- 1564 Dalton St
- 1555 Dalton St
- 1645 Dalton St
- 1655 Dalton St
- 1715 Dalton St
- 1725 Dalton St
- 1225 10th St
- 414 Main St
- 0 220th St
- 1034 Hawley St
- 814 Duroe St
- Lot 4 Benson Shady Grove Ave
- Lot 2 Benson Shady Grove Ave
- Lot 1 Benson Shady Grove Ave
Your Personal Tour Guide
Ask me questions while you tour the home.