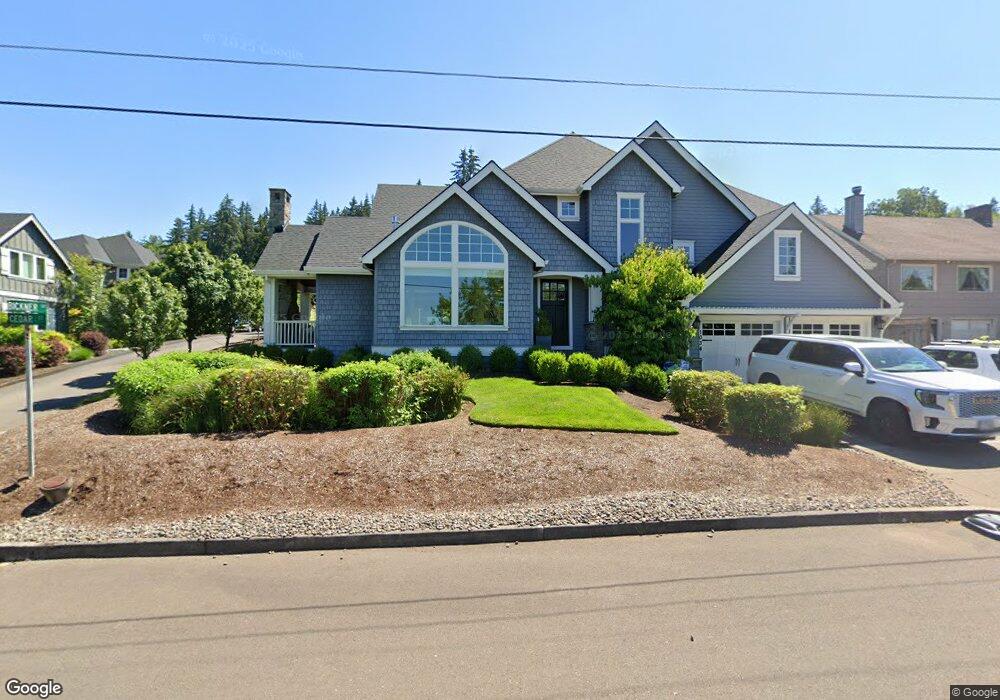
1034 Cedar St Lake Oswego, OR 97034
Hallinan NeighborhoodEstimated Value: $1,268,617 - $1,659,000
4
Beds
4
Baths
2,895
Sq Ft
$487/Sq Ft
Est. Value
About This Home
This home is located at 1034 Cedar St, Lake Oswego, OR 97034 and is currently estimated at $1,409,654, approximately $486 per square foot. 1034 Cedar St is a home located in Clackamas County with nearby schools including Hallinan Elementary School, Lakeridge Middle School, and Lakeridge High School.
Ownership History
Date
Name
Owned For
Owner Type
Purchase Details
Closed on
Aug 20, 2015
Sold by
Edwards Group Llc
Bought by
Grim John and Grim Laura
Current Estimated Value
Home Financials for this Owner
Home Financials are based on the most recent Mortgage that was taken out on this home.
Original Mortgage
$368,589
Outstanding Balance
$287,504
Interest Rate
3.87%
Mortgage Type
FHA
Estimated Equity
$1,122,150
Purchase Details
Closed on
Jan 14, 2015
Sold by
Craig Family Llc
Bought by
Edwards Group Llc
Home Financials for this Owner
Home Financials are based on the most recent Mortgage that was taken out on this home.
Original Mortgage
$650,000
Interest Rate
3.82%
Mortgage Type
Purchase Money Mortgage
Purchase Details
Closed on
Nov 18, 2014
Sold by
Craig Family Llc
Bought by
Craig Family Llc
Home Financials for this Owner
Home Financials are based on the most recent Mortgage that was taken out on this home.
Original Mortgage
$650,000
Interest Rate
3.82%
Mortgage Type
Purchase Money Mortgage
Create a Home Valuation Report for This Property
The Home Valuation Report is an in-depth analysis detailing your home's value as well as a comparison with similar homes in the area
Home Values in the Area
Average Home Value in this Area
Purchase History
| Date | Buyer | Sale Price | Title Company |
|---|---|---|---|
| Grim John | $799,500 | Ticor Title | |
| Edwards Group Llc | $200,000 | Ticor | |
| Craig Family Llc | -- | Ticor Title |
Source: Public Records
Mortgage History
| Date | Status | Borrower | Loan Amount |
|---|---|---|---|
| Open | Grim John | $368,589 | |
| Previous Owner | Edwards Group Llc | $650,000 |
Source: Public Records
Tax History Compared to Growth
Tax History
| Year | Tax Paid | Tax Assessment Tax Assessment Total Assessment is a certain percentage of the fair market value that is determined by local assessors to be the total taxable value of land and additions on the property. | Land | Improvement |
|---|---|---|---|---|
| 2025 | $14,562 | $759,924 | -- | -- |
| 2024 | $14,174 | $737,791 | -- | -- |
| 2023 | $14,174 | $716,302 | $0 | $0 |
| 2022 | $13,349 | $695,439 | $0 | $0 |
| 2021 | $12,328 | $675,184 | $0 | $0 |
| 2020 | $12,018 | $655,519 | $0 | $0 |
| 2019 | $11,723 | $636,427 | $0 | $0 |
| 2018 | $11,147 | $617,890 | $0 | $0 |
| 2017 | $10,756 | $599,893 | $0 | $0 |
| 2016 | $9,791 | $582,420 | $0 | $0 |
| 2015 | $1,762 | $105,314 | $0 | $0 |
Source: Public Records
Map
Nearby Homes
- 1130 Laurel St
- 1206 Cedar St
- 1225 Spruce St
- 1247 Spruce St
- 16081 Pearcy St
- 719 SW Maple St
- 1640 Meadows Dr
- 600 Maple St
- 1060 Upper Devon Ln
- 1535 Larch St
- 668 Mcvey Ave Unit 83
- 1527 Lake Front Rd
- 408 Ridgeway Rd
- 1710 S Shore Blvd
- 630 Ridgeway Rd
- 1725 Southshore Blvd
- 589 Ridgeway Rd
- 17700 Upper Cherry Ln
- 246 Ridgeway Rd
- 1720 Kilkenny Dr