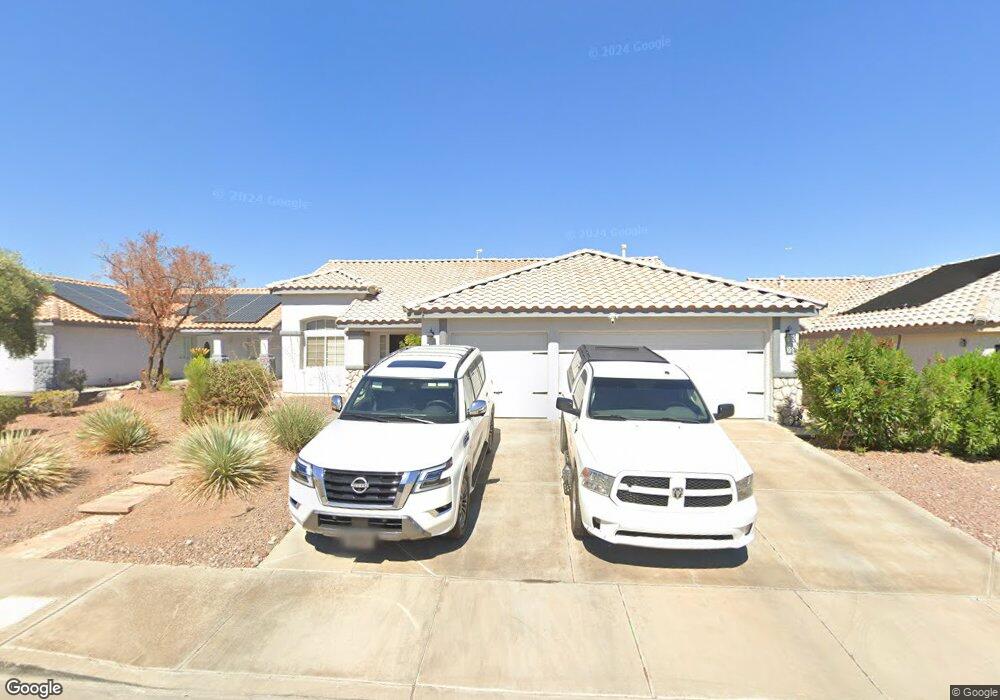
1034 Chaplet Ct Henderson, NV 89074
Gibson Springs NeighborhoodEstimated Value: $498,000 - $543,000
4
Beds
2
Baths
1,800
Sq Ft
$291/Sq Ft
Est. Value
About This Home
This home is located at 1034 Chaplet Ct, Henderson, NV 89074 and is currently estimated at $523,232, approximately $290 per square foot. 1034 Chaplet Ct is a home located in Clark County with nearby schools including Lorna J Kesterson Elementary School, Barbara and Hank Greenspun Junior High School, and Foothill High School.
Ownership History
Date
Name
Owned For
Owner Type
Purchase Details
Closed on
Aug 13, 2013
Sold by
Walters Stephen Marshall and Walters Heather Anderson
Bought by
Reilly Brian T O and Reilly Naomi M O
Current Estimated Value
Home Financials for this Owner
Home Financials are based on the most recent Mortgage that was taken out on this home.
Original Mortgage
$211,105
Outstanding Balance
$154,927
Interest Rate
4.37%
Mortgage Type
FHA
Estimated Equity
$368,305
Purchase Details
Closed on
Nov 17, 2000
Sold by
Gibson Ranch Ltd Liability Company
Bought by
Walters Stephen Marshall and Walters Heather Anderson
Home Financials for this Owner
Home Financials are based on the most recent Mortgage that was taken out on this home.
Original Mortgage
$124,800
Interest Rate
7.82%
Create a Home Valuation Report for This Property
The Home Valuation Report is an in-depth analysis detailing your home's value as well as a comparison with similar homes in the area
Home Values in the Area
Average Home Value in this Area
Purchase History
| Date | Buyer | Sale Price | Title Company |
|---|---|---|---|
| Reilly Brian T O | $215,000 | Fidelity National Title M | |
| Walters Stephen Marshall | $156,076 | National Title Company |
Source: Public Records
Mortgage History
| Date | Status | Borrower | Loan Amount |
|---|---|---|---|
| Open | Reilly Brian T O | $211,105 | |
| Previous Owner | Walters Stephen Marshall | $124,800 |
Source: Public Records
Tax History
| Year | Tax Paid | Tax Assessment Tax Assessment Total Assessment is a certain percentage of the fair market value that is determined by local assessors to be the total taxable value of land and additions on the property. | Land | Improvement |
|---|---|---|---|---|
| 2026 | $2,780 | $128,586 | $41,300 | $87,286 |
| 2025 | $2,699 | $131,129 | $41,300 | $89,829 |
| 2024 | $2,621 | $131,129 | $41,300 | $89,829 |
| 2023 | $2,621 | $122,342 | $37,975 | $84,367 |
| 2022 | $2,545 | $106,715 | $29,400 | $77,315 |
| 2021 | $2,471 | $102,054 | $28,700 | $73,354 |
| 2020 | $2,396 | $100,713 | $28,000 | $72,713 |
| 2019 | $2,326 | $96,341 | $24,850 | $71,491 |
| 2018 | $1,848 | $75,845 | $21,000 | $54,845 |
| 2017 | $2,213 | $76,336 | $19,250 | $57,086 |
| 2016 | $1,750 | $71,467 | $14,350 | $57,117 |
| 2015 | $1,746 | $58,350 | $11,550 | $46,800 |
| 2014 | $1,692 | $59,038 | $9,100 | $49,938 |
Source: Public Records
Map
Nearby Homes
- 1036 Chaplet Ct
- 1025 Tabor Hill Ave
- 222 Winterport St
- 208 Winterport St
- 197 Genesee Point St Unit 2
- 197 Bailey Island Dr Unit 6103
- 1001 Wreath Ct
- 1194 Simms Ave Unit 3103
- 268 Copper Glow Ct
- 1104 Broomfield Dr
- 246 Amber Light Ct
- 270 Newelton Ct
- 266 Corvallis Ct
- 233 Leaf Bud Ct
- 270 Collindale St
- 1142 Jesse Harbor Ave
- 1016 Devon Creek Ave
- 389 Wilford Springs St
- 388 Monique Springs St
- 1070 Fish Pond Ave
- 1032 Chaplet Ct
- 1035 Aspen Daisy Ave
- 1033 Aspen Daisy Ave
- 1030 Chaplet Ct
- 1038 Chaplet Ct
- 1037 Aspen Daisy Ave Unit 11A
- 1031 Aspen Daisy Ave
- 1035 Chaplet Ct
- 1033 Chaplet Ct Unit 11B
- 1039 Aspen Daisy Ave
- 1037 Chaplet Ct
- 1040 Chaplet Ct
- 1031 Chaplet Ct
- 246 Ventana Village Ln
- 248 Ventana Village Ln
- 1039 Chaplet Ct
- 244 Ventana Village Ln
- 242 Crossview St
- 250 Ventana Village Ln
- 244 Crossview St
Your Personal Tour Guide
Ask me questions while you tour the home.