Estimated Value: $480,000 - $532,000
4
Beds
2
Baths
1,732
Sq Ft
$291/Sq Ft
Est. Value
About This Home
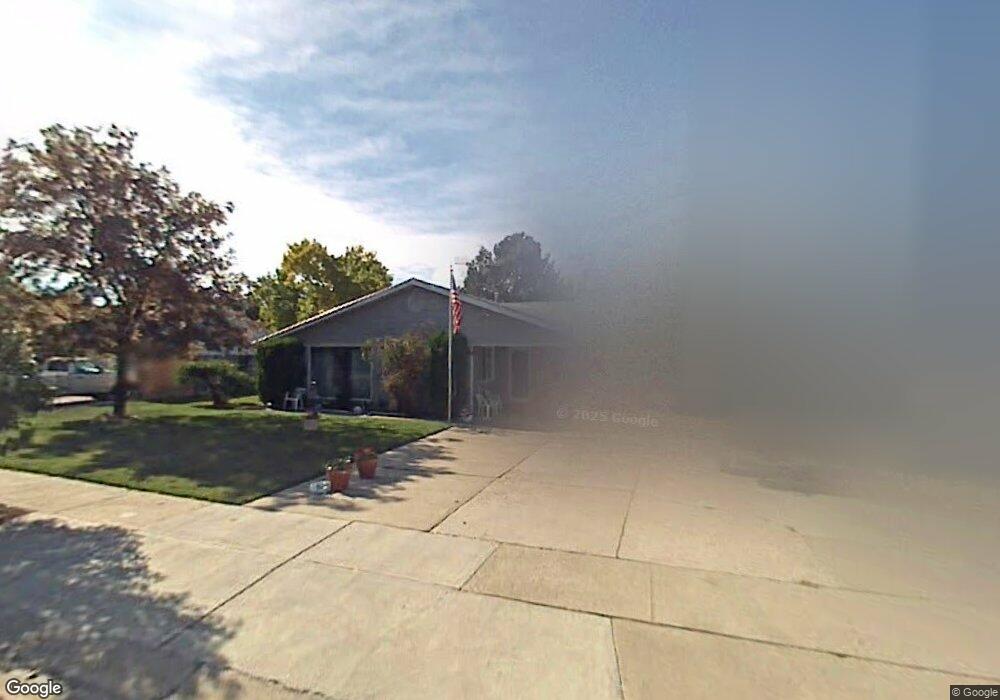
This home is located at 1034 E Diamond Way, Sandy, UT 84094 and is currently estimated at $503,593, approximately $290 per square foot. 1034 E Diamond Way is a home located in Salt Lake County with nearby schools including Eastmont Middle School, Jordan High, and Blessed Sacrament Catholic School.
Ownership History
Date
Name
Owned For
Owner Type
Purchase Details
Closed on
Feb 10, 2021
Sold by
Crawford Cynthia and Dean Jeffrey
Bought by
Dean Jeffrey and Dean Michael
Current Estimated Value
Purchase Details
Closed on
Oct 2, 2020
Sold by
Crawford Cynthia
Bought by
Crawford Cynthia and Dean Jeffrey
Purchase Details
Closed on
Dec 19, 2016
Sold by
Savage Lynwood Emmett and Savage Deann Buttars
Bought by
Crawford Cynthia
Home Financials for this Owner
Home Financials are based on the most recent Mortgage that was taken out on this home.
Original Mortgage
$252,345
Outstanding Balance
$209,683
Interest Rate
4.5%
Mortgage Type
FHA
Estimated Equity
$293,910
Purchase Details
Closed on
Jan 31, 2012
Sold by
Savage Lynnwood Emmett and Savage Deann Buttars
Bought by
Savage Lynnwood Emmett and Savage Deann Buttars
Home Financials for this Owner
Home Financials are based on the most recent Mortgage that was taken out on this home.
Original Mortgage
$265,500
Interest Rate
3.9%
Mortgage Type
Reverse Mortgage Home Equity Conversion Mortgage
Create a Home Valuation Report for This Property
The Home Valuation Report is an in-depth analysis detailing your home's value as well as a comparison with similar homes in the area
Home Values in the Area
Average Home Value in this Area
Purchase History
| Date | Buyer | Sale Price | Title Company |
|---|---|---|---|
| Dean Jeffrey | -- | None Available | |
| Crawford Cynthia | -- | None Available | |
| Crawford Cynthia | -- | Artisan Title | |
| Savage Lynnwood Emmett | -- | Surety Title |
Source: Public Records
Mortgage History
| Date | Status | Borrower | Loan Amount |
|---|---|---|---|
| Open | Crawford Cynthia | $252,345 | |
| Previous Owner | Savage Lynnwood Emmett | $265,500 |
Source: Public Records
Tax History
| Year | Tax Paid | Tax Assessment Tax Assessment Total Assessment is a certain percentage of the fair market value that is determined by local assessors to be the total taxable value of land and additions on the property. | Land | Improvement |
|---|---|---|---|---|
| 2025 | $2,910 | $450,500 | $125,000 | $325,500 |
| 2024 | $2,910 | $435,400 | $116,800 | $318,600 |
| 2023 | $2,969 | $434,600 | $111,100 | $323,500 |
| 2022 | $3,060 | $443,100 | $108,900 | $334,200 |
| 2021 | $2,527 | $320,300 | $84,600 | $235,700 |
| 2020 | $2,481 | $294,200 | $84,600 | $209,600 |
| 2019 | $2,287 | $268,900 | $79,900 | $189,000 |
| 2016 | $1,805 | $205,400 | $79,900 | $125,500 |
Source: Public Records
Map
Nearby Homes
- 1062 E Diamond Way
- 1123 E Sego Lily Dr
- 941 E Carnation Dr
- 954 E Carnation Dr
- 9976 Tamara St E
- 10366 S Larkspur Cir
- 845 Larkspur Dr
- 9968 S Blossom Dr
- 9587 S 1040 E
- 10351 S Zinnia Way
- 9633 S 1210 E
- 10517 S Larkspur Dr
- 837 E 10515 S
- 10491 Amaryllis St
- 10172 Snow Iris Way
- 1119 E 10600 S
- 10522 Amaryllis St
- 717 Sand Dollar Dr
- 1420 E Firelight Way
- 1469 Winterwood Cir
- 1034 Diamond Way
- 1028 Diamond Way
- 1028 E Diamond Way
- 1040 Diamond Way
- 1017 Sego Lily Dr
- 1023 Sego Lily Dr
- 1020 Diamond Way
- 1020 E Diamond Way Unit SI ID1249911P
- 1020 E Diamond Way Unit ID1249911P
- 1020 E Diamond Way
- 10068 S Flint Dr
- 10068 Flint Dr
- 1009 E Sego Lily Dr
- 1009 Sego Lily Dr
- 1039 Diamond Way
- 1043 E Diamond Way
- 1031 E Diamond Way
- 1031 Diamond Way
- 1043 Diamond Way
- 10074 Flint Dr
Your Personal Tour Guide
Ask me questions while you tour the home.