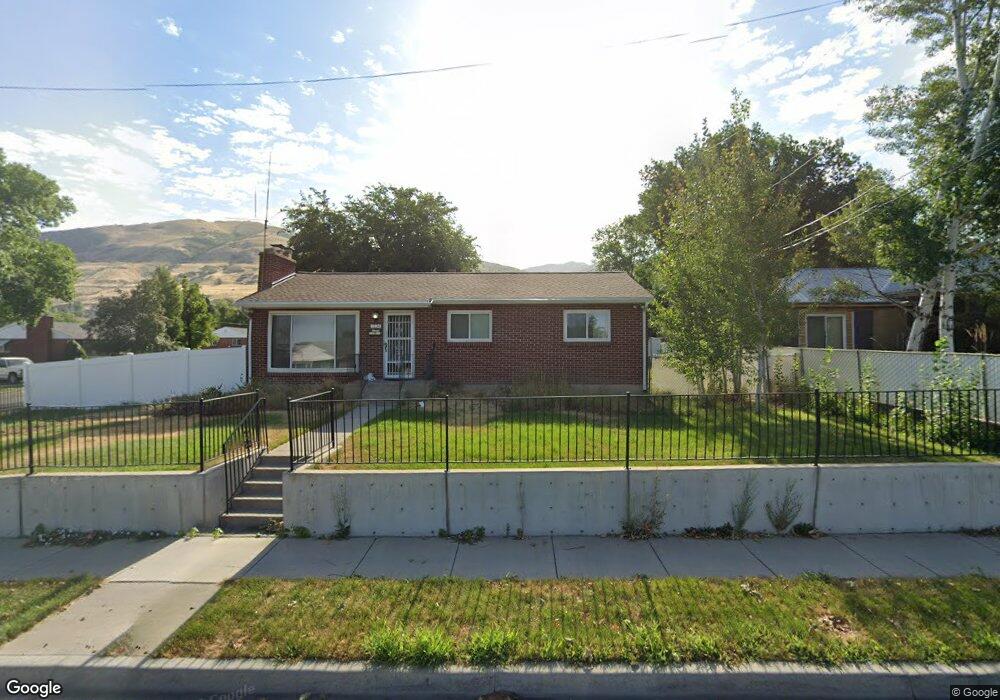
1034 N 400 E Bountiful, UT 84010
Estimated Value: $475,000 - $548,000
4
Beds
2
Baths
2,132
Sq Ft
$242/Sq Ft
Est. Value
About This Home
This home is located at 1034 N 400 E, Bountiful, UT 84010 and is currently estimated at $516,467, approximately $242 per square foot. 1034 N 400 E is a home located in Davis County with nearby schools including Tolman School, Bountiful Junior High School, and Viewmont High School.
Ownership History
Date
Name
Owned For
Owner Type
Purchase Details
Closed on
Jul 25, 2019
Sold by
Mannos Jeannette S
Bought by
Nelson Lacey and Nelson Andrew
Current Estimated Value
Home Financials for this Owner
Home Financials are based on the most recent Mortgage that was taken out on this home.
Original Mortgage
$276,450
Outstanding Balance
$242,195
Interest Rate
3.82%
Mortgage Type
New Conventional
Estimated Equity
$274,272
Purchase Details
Closed on
Feb 1, 2006
Sold by
Scott Katherine A
Bought by
Scott Katherine Ann and Mannos Jeannette S
Home Financials for this Owner
Home Financials are based on the most recent Mortgage that was taken out on this home.
Original Mortgage
$103,000
Interest Rate
6.21%
Mortgage Type
New Conventional
Purchase Details
Closed on
Jan 19, 2005
Sold by
Scott Katherine Ann
Bought by
Scott Katherine Ann and Mannos Jeannette S
Create a Home Valuation Report for This Property
The Home Valuation Report is an in-depth analysis detailing your home's value as well as a comparison with similar homes in the area
Purchase History
| Date | Buyer | Sale Price | Title Company |
|---|---|---|---|
| Nelson Lacey | -- | Vanguard Title Ins Union Pa | |
| Scott Katherine Ann | -- | First American Title | |
| Scott Katherine A | -- | First American Title | |
| Scott Katherine Ann | -- | -- |
Source: Public Records
Mortgage History
| Date | Status | Borrower | Loan Amount |
|---|---|---|---|
| Open | Nelson Lacey | $276,450 | |
| Previous Owner | Scott Katherine A | $103,000 |
Source: Public Records
Tax History
| Year | Tax Paid | Tax Assessment Tax Assessment Total Assessment is a certain percentage of the fair market value that is determined by local assessors to be the total taxable value of land and additions on the property. | Land | Improvement |
|---|---|---|---|---|
| 2025 | $2,782 | $247,500 | $112,532 | $134,968 |
| 2024 | $2,603 | $240,900 | $103,684 | $137,216 |
| 2023 | $2,500 | $420,000 | $188,911 | $231,089 |
| 2022 | $2,630 | $243,100 | $100,721 | $142,379 |
| 2021 | $2,395 | $339,000 | $149,778 | $189,222 |
| 2020 | $2,106 | $298,000 | $136,361 | $161,639 |
| 2019 | $2,033 | $280,000 | $132,302 | $147,698 |
| 2018 | $1,873 | $253,000 | $123,174 | $129,826 |
| 2016 | $1,615 | $118,030 | $40,153 | $77,877 |
| 2015 | $1,599 | $110,440 | $40,153 | $70,287 |
| 2014 | $1,655 | $118,349 | $40,153 | $78,196 |
| 2013 | -- | $103,212 | $41,748 | $61,464 |
Source: Public Records
Map
Nearby Homes
- 662 E 1200 N
- 453 N 400 E Unit 7-D
- 1420 N Main St
- 345 N 400 E
- 610 E Pages Ln
- 967 S Courtyard Ln
- 975 E 1050 N
- 106 W 700 N
- 1023 E 800 N
- 683 E 100 N
- 49 E 200 N Unit 4
- 41 E 200 N Unit 6
- 96 Village Square Rd
- 184 Park Shadows Cir
- 1260 N 200 W
- 1130 N 200 W
- 252 N Main St
- 256 N Main St
- 254 N Main St
- 55 E 200 N Unit 2
Your Personal Tour Guide
Ask me questions while you tour the home.