1034 N Main St Unit 2 Randolph, MA 02368
North Randolph NeighborhoodHighlights
- Property is near public transit
- Shops
- Heating Available
- No HOA
About This Home
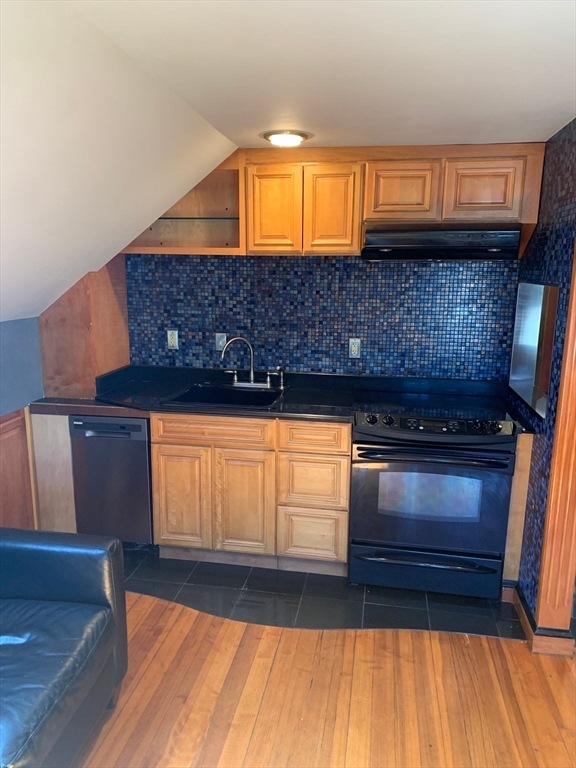
This home is located at 1034 N Main St Unit 2, Randolph, MA 02368 and is currently priced at $2,000. This property was built in 1920. 1034 N Main St Unit 2 is a home located in Norfolk County with nearby schools including Randolph High School and Lighthouse Baptist Christian Academy.
Property Details
Home Type
- Multi-Family
Est. Annual Taxes
- $4,598
Year Built
- Built in 1920
Parking
- 1 Car Parking Space
Home Design
- 600 Sq Ft Home
- Property Attached
- Entry on the 2nd floor
Kitchen
- Range
- Microwave
- Freezer
- Dishwasher
- Disposal
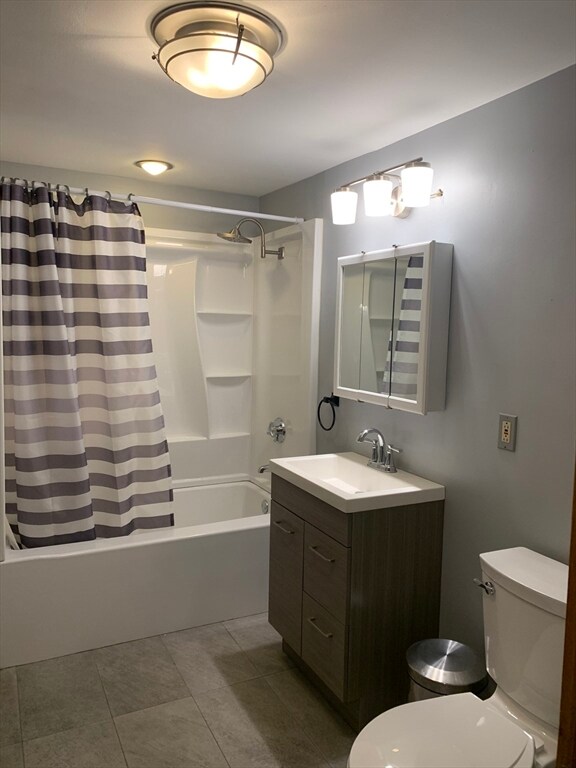
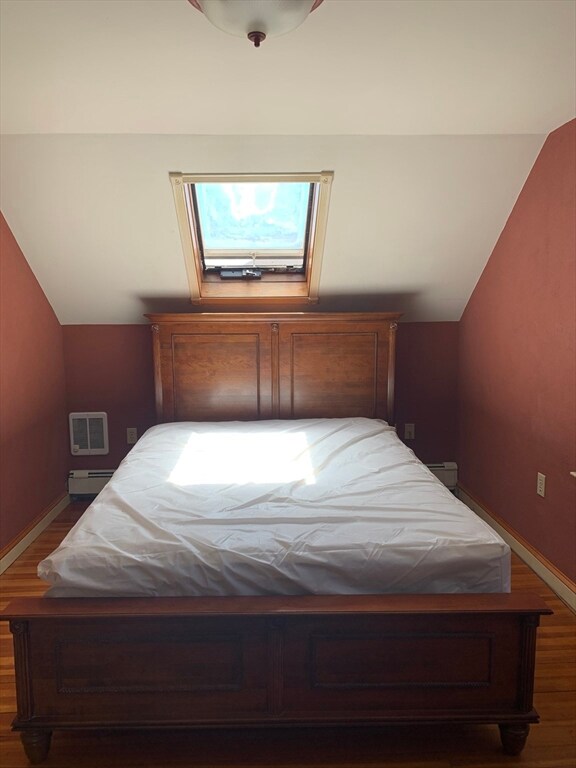
Bedrooms and Bathrooms
- 1 Bedroom
- 1 Full Bathroom
Location
- Property is near public transit
- Property is near schools
Schools
- Rps Elementary And Middle School
- Rps High School
Utilities
- No Cooling
- Heating Available
Additional Features
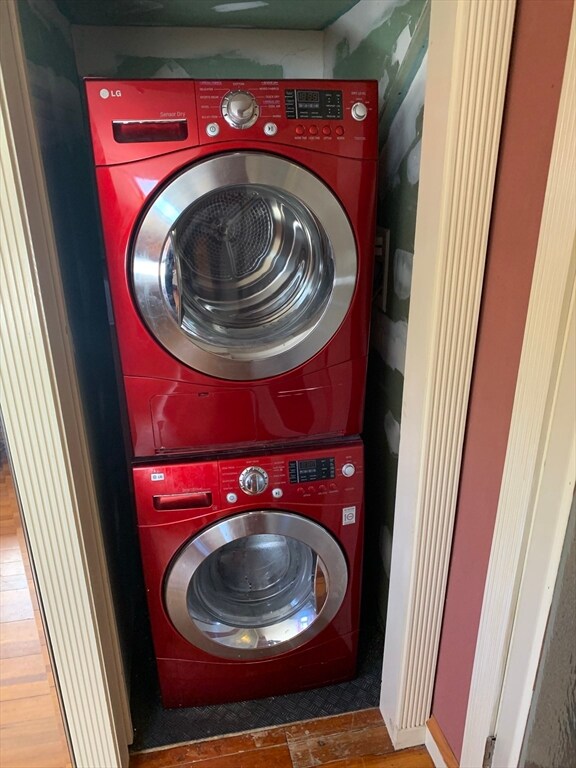
- Laundry in unit
- 9,999 Sq Ft Lot
Listing and Financial Details
- Property Available on 12/1/25
- Rent includes heat, hot water, electricity, water, sewer
- Assessor Parcel Number 207729
Community Details
Pet Policy
- No Pets Allowed
Additional Features
- No Home Owners Association
- Shops
Map
Source: MLS Property Information Network (MLS PIN)
MLS Number: 73457020
APN: RAND-000012-E000000-000002
Disclaimer: Certain information contained herein is derived from information provided by parties other than Homes.com. All information provided is deemed reliable, but is not guaranteed to be accurate and should be independently verified.
![]() The property listing data and information, or the Images, set forth herein were provided to MLS Property Information Network, Inc. from third party sources, including sellers, lessors and public records, and were compiled by MLS Property Information Network, Inc. The property listing data and information, and the Images, are for the personal, non-commercial use of consumers having a good faith interest in purchasing or leasing listed properties of the type displayed to them and may not be used for any purpose other than to identify prospective properties which such consumers may have a good faith interest in purchasing or leasing. MLS Property Information Network, Inc. and its subscribers disclaim any and all representations and warranties as to the accuracy of the property listing data and information, or as to the accuracy of any of the Images, set forth herein.
The property listing data and information, or the Images, set forth herein were provided to MLS Property Information Network, Inc. from third party sources, including sellers, lessors and public records, and were compiled by MLS Property Information Network, Inc. The property listing data and information, and the Images, are for the personal, non-commercial use of consumers having a good faith interest in purchasing or leasing listed properties of the type displayed to them and may not be used for any purpose other than to identify prospective properties which such consumers may have a good faith interest in purchasing or leasing. MLS Property Information Network, Inc. and its subscribers disclaim any and all representations and warranties as to the accuracy of the property listing data and information, or as to the accuracy of any of the Images, set forth herein.
- 11 Royal Crest Dr Unit 5
- 9 Royal Crest Dr Unit 12
- 23 Emeline St
- 11 Rockefeller St
- 304 High St
- 7 Webster St
- 17 Hills St
- 3 Franklin Square Unit H
- 1277 N Main St
- 26 Knights Crescent St
- 11 Glen Ln
- 10 Michael Rd
- 33 Michael Rd
- 229 Chestnut St
- 107 Chestnut Cir
- 34 Orchard St
- 1 Clark Cir
- 232 Canton St Unit 205
- 232 Canton St Unit 104
- 232 Canton St Unit 112
- 10-30 Reed St
- 6 Francis Dr
- 8 Robert Rd
- 2 Chestnut W
- 5 Pacella Park Dr
- 9 Bay Dr
- 15 Robert Arey Dr Unit 15
- 100 Liberty Place
- 22 Nelson Dr Unit 3E
- 45 West St Unit 42 West St., #10
- 453 Pond St Unit 3
- 599 North St
- 84 Pleasant St Unit 3
- 800 West St
- 25 Warren Ave
- 354 Pond St Unit 354
- 47 Cottage St
- 47 Cottage St
- 19 Highland Ave
- 41 Highland Ave
