Estimated Value: $184,213 - $198,000
3
Beds
2
Baths
1,530
Sq Ft
$123/Sq Ft
Est. Value
About This Home
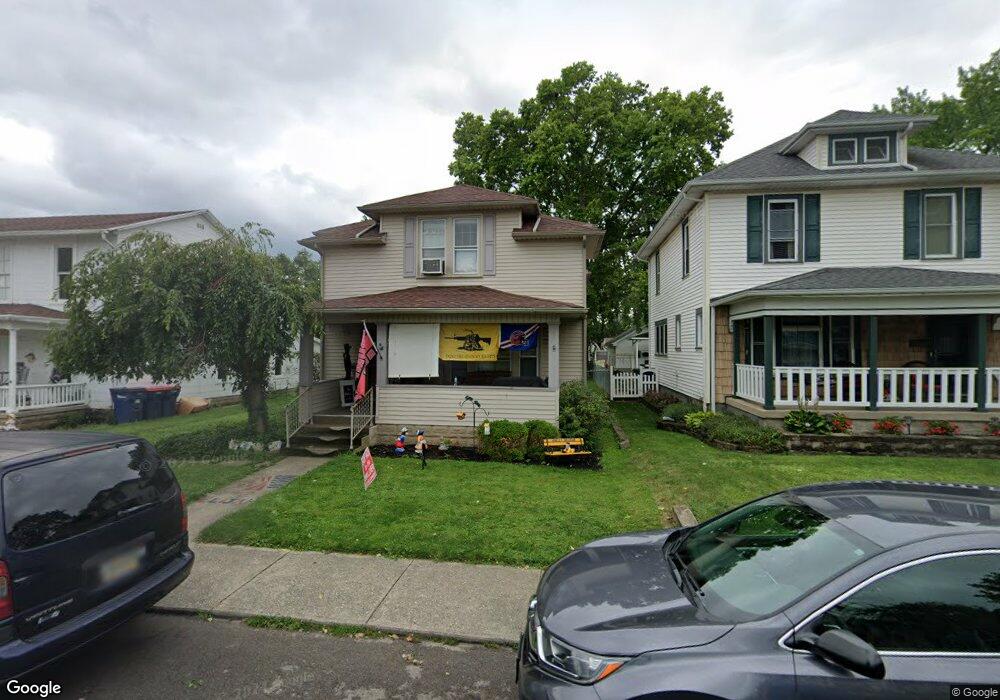
This home is located at 1034 Nicklin Ave, Piqua, OH 45356 and is currently estimated at $188,553, approximately $123 per square foot. 1034 Nicklin Ave is a home located in Miami County with nearby schools including Piqua Central Intermediate School, Springcreek Primary School, and Piqua Junior High School.
Ownership History
Date
Name
Owned For
Owner Type
Purchase Details
Closed on
Apr 22, 2016
Sold by
Pence Eric B and Pence Heather J
Bought by
Godfrey Sarah Marie
Current Estimated Value
Home Financials for this Owner
Home Financials are based on the most recent Mortgage that was taken out on this home.
Original Mortgage
$4,995
Outstanding Balance
$3,983
Interest Rate
3.71%
Mortgage Type
Stand Alone Second
Estimated Equity
$184,570
Purchase Details
Closed on
Jan 1, 1990
Bought by
Stahl Frederick L
Create a Home Valuation Report for This Property
The Home Valuation Report is an in-depth analysis detailing your home's value as well as a comparison with similar homes in the area
Home Values in the Area
Average Home Value in this Area
Purchase History
| Date | Buyer | Sale Price | Title Company |
|---|---|---|---|
| Godfrey Sarah Marie | $99,900 | Attorney | |
| Stahl Frederick L | -- | -- |
Source: Public Records
Mortgage History
| Date | Status | Borrower | Loan Amount |
|---|---|---|---|
| Open | Godfrey Sarah Marie | $4,995 | |
| Open | Godfrey Sarah Marie | $98,090 |
Source: Public Records
Tax History Compared to Growth
Tax History
| Year | Tax Paid | Tax Assessment Tax Assessment Total Assessment is a certain percentage of the fair market value that is determined by local assessors to be the total taxable value of land and additions on the property. | Land | Improvement |
|---|---|---|---|---|
| 2024 | $1,823 | $44,350 | $9,420 | $34,930 |
| 2023 | $1,823 | $44,350 | $9,420 | $34,930 |
| 2022 | $1,854 | $44,350 | $9,420 | $34,930 |
| 2021 | $1,560 | $34,130 | $7,250 | $26,880 |
| 2020 | $1,529 | $34,130 | $7,250 | $26,880 |
| 2019 | $1,537 | $34,130 | $7,250 | $26,880 |
| 2018 | $1,143 | $24,230 | $7,530 | $16,700 |
| 2017 | $1,157 | $24,230 | $7,530 | $16,700 |
| 2016 | $1,177 | $24,230 | $7,530 | $16,700 |
| 2015 | $1,159 | $23,320 | $7,250 | $16,070 |
| 2014 | $1,159 | $23,320 | $7,250 | $16,070 |
| 2013 | $1,163 | $23,320 | $7,250 | $16,070 |
Source: Public Records
Map
Nearby Homes