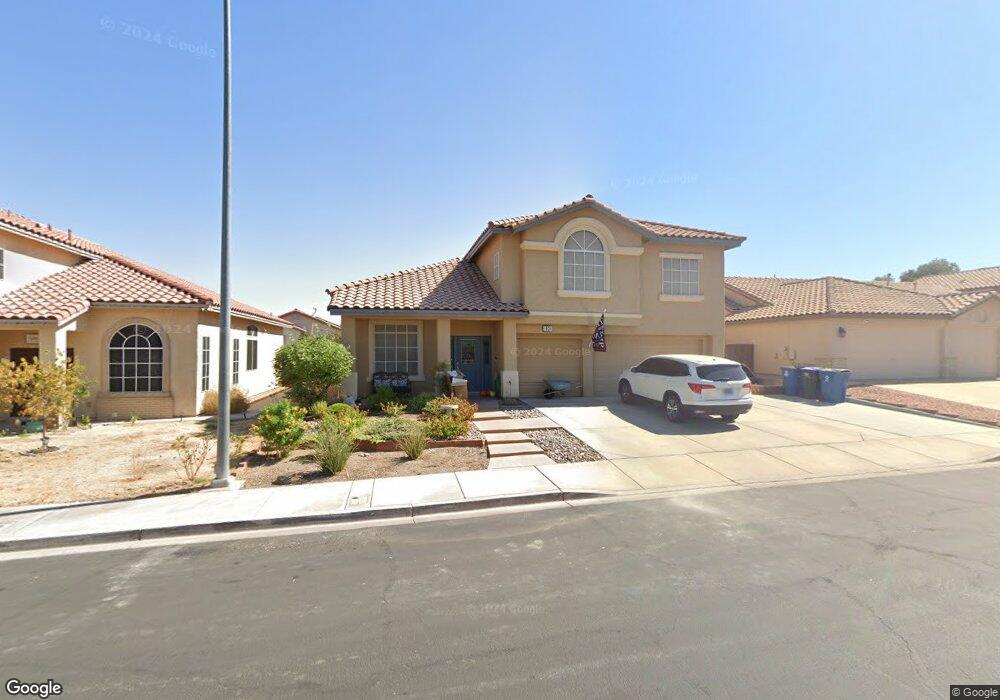
1034 Spring Pond Ct Henderson, NV 89002
Paradise Hills NeighborhoodEstimated Value: $546,285 - $596,000
4
Beds
3
Baths
2,758
Sq Ft
$206/Sq Ft
Est. Value
About This Home
This home is located at 1034 Spring Pond Ct, Henderson, NV 89002 and is currently estimated at $569,321, approximately $206 per square foot. 1034 Spring Pond Ct is a home located in Clark County with nearby schools including James E & A Rae Smalley Elementary School, Jack & Terry Mannion Middle School, and Foothill High School.
Ownership History
Date
Name
Owned For
Owner Type
Purchase Details
Closed on
Jul 18, 2018
Sold by
Biddinger Sheila A and Biddinger John W
Bought by
Biddinger John W and Biddinger Sheila A
Current Estimated Value
Purchase Details
Closed on
Jul 27, 2007
Sold by
Biddinger John W and Biddinger Sheila A
Bought by
Biddinger Sheila A and Biddinger John W
Home Financials for this Owner
Home Financials are based on the most recent Mortgage that was taken out on this home.
Original Mortgage
$179,300
Outstanding Balance
$113,524
Interest Rate
6.66%
Mortgage Type
New Conventional
Estimated Equity
$455,797
Purchase Details
Closed on
Jun 7, 1996
Sold by
Lewis Properties
Bought by
Biddinger John W and Biddinger Sheila A
Home Financials for this Owner
Home Financials are based on the most recent Mortgage that was taken out on this home.
Original Mortgage
$135,500
Interest Rate
7.96%
Create a Home Valuation Report for This Property
The Home Valuation Report is an in-depth analysis detailing your home's value as well as a comparison with similar homes in the area
Home Values in the Area
Average Home Value in this Area
Purchase History
| Date | Buyer | Sale Price | Title Company |
|---|---|---|---|
| Biddinger John W | -- | None Available | |
| Biddinger Sheila A | -- | National Alliance Title | |
| Biddinger John W | $169,500 | First American Title Co |
Source: Public Records
Mortgage History
| Date | Status | Borrower | Loan Amount |
|---|---|---|---|
| Open | Biddinger Sheila A | $179,300 | |
| Closed | Biddinger John W | $135,500 |
Source: Public Records
Tax History Compared to Growth
Tax History
| Year | Tax Paid | Tax Assessment Tax Assessment Total Assessment is a certain percentage of the fair market value that is determined by local assessors to be the total taxable value of land and additions on the property. | Land | Improvement |
|---|---|---|---|---|
| 2025 | $2,222 | $120,462 | $32,200 | $88,262 |
| 2024 | $2,157 | $120,462 | $32,200 | $88,262 |
| 2023 | $2,157 | $122,473 | $38,500 | $83,973 |
| 2022 | $2,095 | $109,160 | $32,200 | $76,960 |
| 2021 | $2,034 | $103,625 | $30,450 | $73,175 |
| 2020 | $1,972 | $101,966 | $29,400 | $72,566 |
| 2019 | $1,914 | $97,709 | $25,900 | $71,809 |
| 2018 | $1,858 | $90,601 | $21,700 | $68,901 |
| 2017 | $2,640 | $91,063 | $21,000 | $70,063 |
| 2016 | $1,760 | $78,737 | $15,050 | $63,687 |
| 2015 | $1,756 | $67,890 | $11,200 | $56,690 |
| 2014 | $1,705 | $57,106 | $10,500 | $46,606 |
Source: Public Records
Map
Nearby Homes
- 1028 Twin Berry Ct
- 181 Ridge Crossing Ave
- 641 Patti Ann Woods Dr
- 132 Westin Ln
- 510 Patti Ann Woods Dr
- 503 Credence Ave
- 322 Wintercress Dr
- 837 Holly Lake Way
- 624 Monument Point St
- 848 Coral Cottage Dr
- 1014 Pleasing Plateau St
- 680 Moonlight Stroll St
- 167 Desert Pond Ave
- 645 Monument Point St
- 653 Monument Point St
- 144 Afternoon Rain Ave
- 688 Monument Point St
- 1040 Wavehugger Dr
- 1045 Wavehugger Dr
- 1030 Wavehugger Dr
- 1032 Spring Pond Ct
- 1036 Spring Pond Ct
- 1033 Secluded Acres Ct
- 1031 Secluded Acres Ct
- 1030 Spring Pond Ct
- 1035 Secluded Acres Ct
- 1033 Spring Pond Ct
- 1029 Secluded Acres Ct
- 1031 Spring Pond Ct
- 1037 Secluded Acres Ct
- 1035 Spring Pond Ct
- 1028 Spring Pond Ct
- 1029 Spring Pond Ct
- 1040 Spring Pond Ct
- 1027 Secluded Acres Ct
- 1037 Spring Pond Ct
- 1027 Spring Pond Ct
- 1039 Secluded Acres Ct
- 1026 Spring Pond Ct
- 1039 Spring Pond Ct