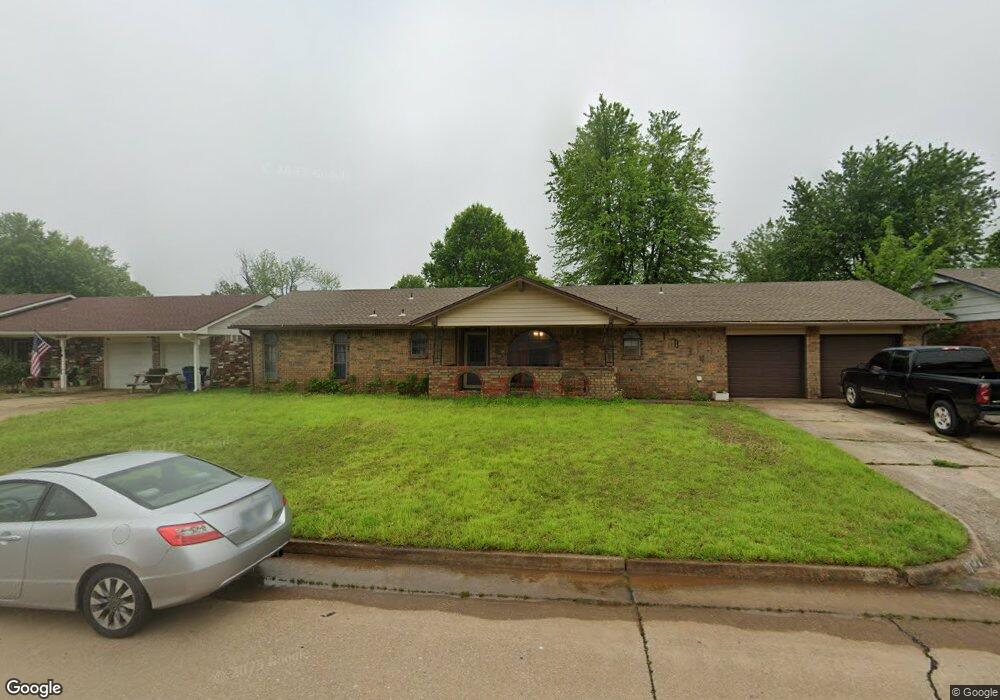
1034 W Dorchester Way Mustang, OK 73064
Estimated Value: $193,000 - $214,000
3
Beds
2
Baths
1,450
Sq Ft
$139/Sq Ft
Est. Value
About This Home
This home is located at 1034 W Dorchester Way, Mustang, OK 73064 and is currently estimated at $202,243, approximately $139 per square foot. 1034 W Dorchester Way is a home located in Canadian County with nearby schools including Mustang Lakehoma Elementary School, Mustang Horizon Intermediate School, and Mustang Middle School.
Ownership History
Date
Name
Owned For
Owner Type
Purchase Details
Closed on
Dec 28, 2012
Sold by
Cernocky Christopher M
Bought by
Johnson Melissa D
Current Estimated Value
Purchase Details
Closed on
Sep 22, 2003
Sold by
Hills Land and Hills Construction~Co
Home Financials for this Owner
Home Financials are based on the most recent Mortgage that was taken out on this home.
Original Mortgage
$91,647
Interest Rate
6.22%
Purchase Details
Closed on
Aug 13, 2003
Sold by
Lewis Michael J and Lewis Shanna
Home Financials for this Owner
Home Financials are based on the most recent Mortgage that was taken out on this home.
Original Mortgage
$91,647
Interest Rate
6.22%
Purchase Details
Closed on
Sep 27, 2002
Sold by
Boord Dennis and Boord Sandra
Home Financials for this Owner
Home Financials are based on the most recent Mortgage that was taken out on this home.
Original Mortgage
$85,385
Interest Rate
6.26%
Create a Home Valuation Report for This Property
The Home Valuation Report is an in-depth analysis detailing your home's value as well as a comparison with similar homes in the area
Home Values in the Area
Average Home Value in this Area
Purchase History
| Date | Buyer | Sale Price | Title Company |
|---|---|---|---|
| Johnson Melissa D | -- | None Available | |
| -- | $90,000 | -- | |
| -- | $89,900 | -- | |
| -- | $90,000 | -- |
Source: Public Records
Mortgage History
| Date | Status | Borrower | Loan Amount |
|---|---|---|---|
| Previous Owner | -- | $91,647 | |
| Previous Owner | -- | $85,385 |
Source: Public Records
Tax History Compared to Growth
Tax History
| Year | Tax Paid | Tax Assessment Tax Assessment Total Assessment is a certain percentage of the fair market value that is determined by local assessors to be the total taxable value of land and additions on the property. | Land | Improvement |
|---|---|---|---|---|
| 2024 | $1,628 | $17,133 | $1,800 | $15,333 |
| 2023 | $1,628 | $16,317 | $1,800 | $14,517 |
| 2022 | $1,569 | $15,540 | $1,800 | $13,740 |
| 2021 | $1,500 | $14,800 | $1,800 | $13,000 |
| 2020 | $1,438 | $14,096 | $1,800 | $12,296 |
| 2019 | $1,369 | $13,424 | $1,800 | $11,624 |
| 2018 | $1,333 | $12,785 | $1,800 | $10,985 |
| 2017 | $1,255 | $12,176 | $1,800 | $10,376 |
| 2016 | $1,228 | $11,897 | $1,800 | $10,097 |
| 2015 | $1,135 | $11,340 | $1,800 | $9,540 |
| 2014 | $1,135 | $11,928 | $1,200 | $10,728 |
Source: Public Records
Map
Nearby Homes
- 1035 W Windsor Way
- 508 N Caddell Way
- 313 N Shannon Way
- 608 N Remington Way
- 513 N Shannon Way
- 400 N Amethyst Way
- 601 N Chisholm Trail Way
- 850 W Forest Dr
- 844 W Forest Dr
- 401 N Topaz Way
- 309 N Topaz Way
- 1005 W Ridgehaven Way
- 628 W Alamo Court Way
- 1308 W Harvard Way
- 602 W Shadow Ridge Way
- 1208 W Flowering Peach Way
- 1316 W Harvard Way
- 531 W Shadow Ridge Way
- 609 N Centennial Way
- 520 S Owen Dr
- 1040 W Dorchester Way
- 1028 W Dorchester Way
- 1041 W Windsor Way
- 1033 W Dorchester Way
- 1047 W Windsor Way
- 1039 W Dorchester Way
- 1022 W Dorchester Way
- 1027 W Dorchester Way
- 1029 W Windsor Way
- 1053 W Windsor Way
- 1021 W Dorchester Way
- 1018 W Dorchester Way
- 1105 W Dorchester Way
- 1023 W Windsor Way
- 1112 W Dorchester Way
- 1030 W Churchill Way
- 1111 W Dorchester Way
- 1015 W Dorchester Way
- 1018 W Churchill Way
- 1024 W Churchill Way