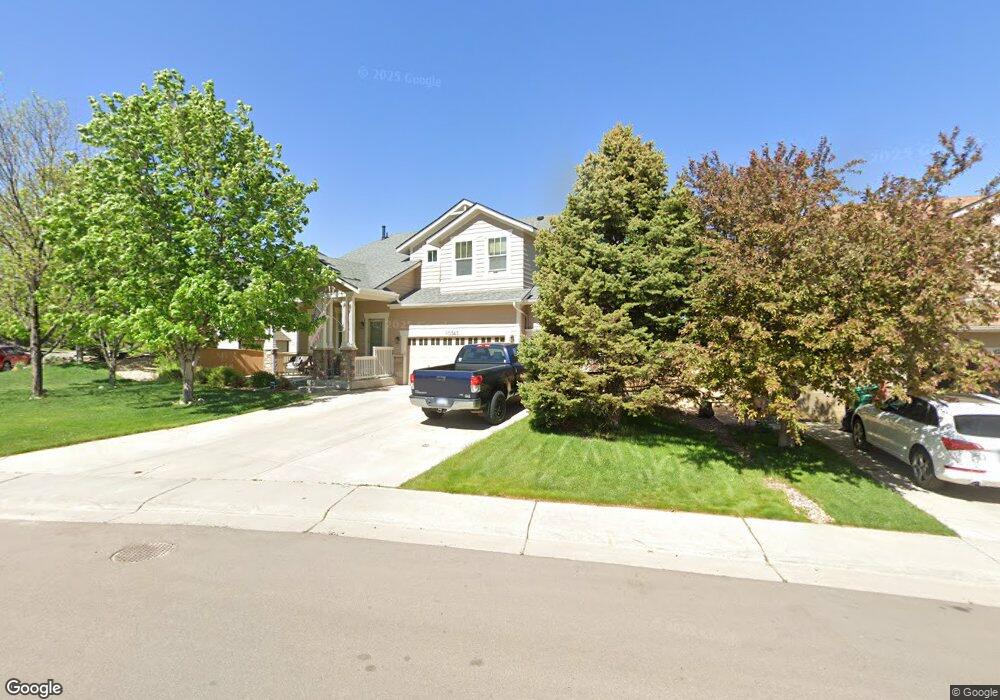
10345 Heatherglen Point Highlands Ranch, CO 80130
Southridge NeighborhoodEstimated Value: $907,000 - $981,000
5
Beds
4
Baths
3,809
Sq Ft
$249/Sq Ft
Est. Value
About This Home
This home is located at 10345 Heatherglen Point, Highlands Ranch, CO 80130 and is currently estimated at $949,276, approximately $249 per square foot. 10345 Heatherglen Point is a home located in Douglas County with nearby schools including Redstone Elementary School, Rocky Heights Middle School, and Rock Canyon High School.
Ownership History
Date
Name
Owned For
Owner Type
Purchase Details
Closed on
Oct 18, 2021
Sold by
Meacham Douglas M and Meacham Heather L
Bought by
Meacham Heather L and The Heather L Meacham Revocabl
Current Estimated Value
Purchase Details
Closed on
May 29, 2014
Sold by
Hughes Dennis
Bought by
Meacham Douglas M and Meacham Heather L
Home Financials for this Owner
Home Financials are based on the most recent Mortgage that was taken out on this home.
Original Mortgage
$404,000
Outstanding Balance
$309,359
Interest Rate
4.38%
Mortgage Type
New Conventional
Estimated Equity
$639,917
Purchase Details
Closed on
Jan 11, 2006
Sold by
Hughes Dennis and Hughes Dianna Smith
Bought by
Hughes Dennis
Purchase Details
Closed on
Feb 24, 2005
Sold by
The Ryland Group Inc
Bought by
Hughes Dennis E and Smith Dianna L
Home Financials for this Owner
Home Financials are based on the most recent Mortgage that was taken out on this home.
Original Mortgage
$227,450
Interest Rate
5.77%
Mortgage Type
Unknown
Purchase Details
Closed on
Apr 29, 2003
Sold by
Shea Homes Lp
Bought by
Ryland Group Inc
Create a Home Valuation Report for This Property
The Home Valuation Report is an in-depth analysis detailing your home's value as well as a comparison with similar homes in the area
Home Values in the Area
Average Home Value in this Area
Purchase History
| Date | Buyer | Sale Price | Title Company |
|---|---|---|---|
| Meacham Heather L | -- | None Available | |
| Meacham Douglas M | $505,000 | Guardian Title | |
| Hughes Dennis | -- | None Available | |
| Hughes Dennis E | $419,332 | Ryland Title Company | |
| Ryland Group Inc | $12,592,000 | -- |
Source: Public Records
Mortgage History
| Date | Status | Borrower | Loan Amount |
|---|---|---|---|
| Open | Meacham Douglas M | $404,000 | |
| Previous Owner | Hughes Dennis E | $227,450 |
Source: Public Records
Tax History Compared to Growth
Tax History
| Year | Tax Paid | Tax Assessment Tax Assessment Total Assessment is a certain percentage of the fair market value that is determined by local assessors to be the total taxable value of land and additions on the property. | Land | Improvement |
|---|---|---|---|---|
| 2024 | $5,821 | $65,450 | $11,840 | $53,610 |
| 2023 | $5,810 | $65,450 | $11,840 | $53,610 |
| 2022 | $4,327 | $47,360 | $8,030 | $39,330 |
| 2021 | $4,500 | $47,360 | $8,030 | $39,330 |
| 2020 | $4,122 | $44,440 | $8,370 | $36,070 |
| 2019 | $4,137 | $44,440 | $8,370 | $36,070 |
| 2018 | $3,850 | $40,740 | $7,280 | $33,460 |
| 2017 | $3,506 | $40,740 | $7,280 | $33,460 |
| 2016 | $3,564 | $40,650 | $7,400 | $33,250 |
| 2015 | $3,641 | $40,650 | $7,400 | $33,250 |
| 2014 | $2,958 | $30,500 | $5,310 | $25,190 |
Source: Public Records
Map
Nearby Homes
- 5632 Tory Pointe
- 4967 Waldenwood Dr
- 4907 Fenwood Dr
- 10360 Tracewood Ct
- 10078 Apollo Bay Way
- 10445 Cheetah Winds
- 10439 Cheetah Winds
- 10278 Dan Ct
- 4848 Fenwood Dr
- 5639 Jaguar Way
- 10292 Nickolas Ave
- 4749 Waldenwood Dr
- 10645 Cedarcrest Cir
- 4925 Kingston Ave
- 4656 Ketchwood Cir
- 10557 Jaguar Dr
- 10660 Jewelberry Cir
- 10547 Laurelglen Cir
- 10048 Brisbane Way
- 10296 Lauren Ct
- 10335 Heatherglen Point
- 5225 Heatherglen Dr
- 10327 Heatherglen Point
- 5201 Heatherglen Dr
- 10342 Heatherglen Point
- 5230 Heatherglen Dr
- 10319 Heatherglen Point
- 5244 Heatherglen Dr
- 10328 Heatherglen Point
- 5189 Heatherglen Dr
- 5216 Heatherglen Dr
- 5258 Heatherglen Dr
- 5202 Heatherglen Dr
- 10316 Heatherglen Point
- 5272 Heatherglen Dr
- 10311 Heatherglen Point
- 5175 Heatherglen Dr
- 5188 Heatherglen Dr
- 10337 Fairlawn Trail
- 5284 Heatherglen Dr