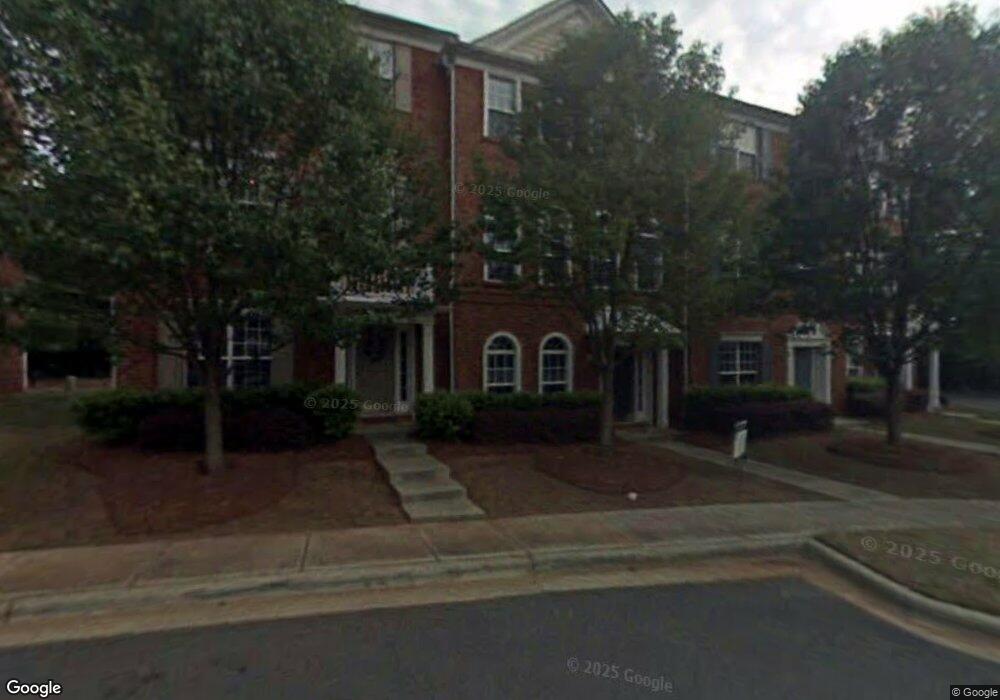
10345 Winslet Dr Unit 7 Charlotte, NC 28277
Ballantyne NeighborhoodEstimated Value: $411,084 - $466,000
3
Beds
4
Baths
1,891
Sq Ft
$228/Sq Ft
Est. Value
About This Home
This home is located at 10345 Winslet Dr Unit 7, Charlotte, NC 28277 and is currently estimated at $432,021, approximately $228 per square foot. 10345 Winslet Dr Unit 7 is a home located in Mecklenburg County with nearby schools including Ballantyne Elementary, Community House Middle School, and Ardrey Kell High.
Ownership History
Date
Name
Owned For
Owner Type
Purchase Details
Closed on
Aug 8, 2014
Sold by
Anderson Travis M
Bought by
Homyakova Ekaterina
Current Estimated Value
Purchase Details
Closed on
May 28, 2008
Sold by
Bailey Steven R and Bailey Dana L
Bought by
Homyakova Ekaterina and Anderson Travis M
Home Financials for this Owner
Home Financials are based on the most recent Mortgage that was taken out on this home.
Original Mortgage
$195,300
Interest Rate
5.86%
Mortgage Type
Purchase Money Mortgage
Purchase Details
Closed on
Feb 15, 2002
Sold by
Pulte Home Corp
Bought by
Bailey Steven R
Home Financials for this Owner
Home Financials are based on the most recent Mortgage that was taken out on this home.
Original Mortgage
$149,600
Interest Rate
7.12%
Create a Home Valuation Report for This Property
The Home Valuation Report is an in-depth analysis detailing your home's value as well as a comparison with similar homes in the area
Home Values in the Area
Average Home Value in this Area
Purchase History
| Date | Buyer | Sale Price | Title Company |
|---|---|---|---|
| Homyakova Ekaterina | -- | None Available | |
| Homyakova Ekaterina | $210,000 | First American | |
| Bailey Steven R | $187,000 | -- |
Source: Public Records
Mortgage History
| Date | Status | Borrower | Loan Amount |
|---|---|---|---|
| Previous Owner | Homyakova Ekaterina | $195,300 | |
| Previous Owner | Bailey Steven R | $149,600 | |
| Closed | Bailey Steven R | $28,050 |
Source: Public Records
Tax History Compared to Growth
Tax History
| Year | Tax Paid | Tax Assessment Tax Assessment Total Assessment is a certain percentage of the fair market value that is determined by local assessors to be the total taxable value of land and additions on the property. | Land | Improvement |
|---|---|---|---|---|
| 2025 | $2,605 | $337,500 | $75,000 | $262,500 |
| 2024 | $2,605 | $337,500 | $75,000 | $262,500 |
| 2023 | $2,520 | $337,500 | $75,000 | $262,500 |
| 2022 | $2,269 | $231,000 | $70,000 | $161,000 |
| 2021 | $2,269 | $231,000 | $70,000 | $161,000 |
| 2020 | $2,269 | $231,000 | $70,000 | $161,000 |
| 2019 | $2,263 | $231,000 | $70,000 | $161,000 |
| 2018 | $2,172 | $163,500 | $28,000 | $135,500 |
| 2017 | $2,140 | $163,500 | $28,000 | $135,500 |
| 2016 | $2,137 | $163,500 | $28,000 | $135,500 |
| 2015 | $2,133 | $163,500 | $28,000 | $135,500 |
| 2014 | $2,139 | $163,500 | $28,000 | $135,500 |
Source: Public Records
Map
Nearby Homes
- 14130 Fitzroy Ln Unit 4D
- 14941 Santa Lucia Dr
- 11544 Costigan Ln Unit 8306
- 14857 Santa Lucia Dr Unit 3309
- 11530 Costigan Ln Unit 8210
- 14451 San Paolo Ln Unit 4305
- 14469 San Paolo Ln Unit 4403
- 14321 San Paolo Ln Unit 5107
- 15203 Arleta Cir Unit 6103
- 14650 Trading Path Way
- 10805 Young Poplar Place
- 10704 Alexander Mill Dr
- 14919 Jockeys Ridge Dr
- 14247 Richmond Park Ave Unit 247
- 14231 Richmond Park Ave Unit 231
- 11612 James Jack Ln
- 10929 Valley Spring Dr
- 15345 Ballancroft Pkwy
- 11247 Blue Cedar Ln
- 11712 Woodmere Trace Dr
- 10345 Winslet Dr Unit 2B
- 10349 Winslet Dr Unit C
- 10341 Winslet Dr Unit 2A
- 10341 Winslet Dr Unit 6
- 10353 Winslet Dr Unit 2D
- 10331 Winslet Dr Unit 1E
- 10331 Winslet Dr Unit 5
- 10327 Winslet Dr Unit 10327
- 10327 Winslet Dr
- 10327 Winslet Dr
- 10327 Winslet Dr
- 10323 Winslet Dr
- 10407 Winslet Dr Unit A
- 10416 Winslet Dr Unit 6G
- 14162 Fitzroy Ln Unit 3A
- 10319 Winslet Dr Unit 1B
- 10411 Winslet Dr
- 14158 Fitzroy Ln Unit 3B
- 10420 Winslet Dr Unit 6G
- 10315 Winslet Dr Unit 1