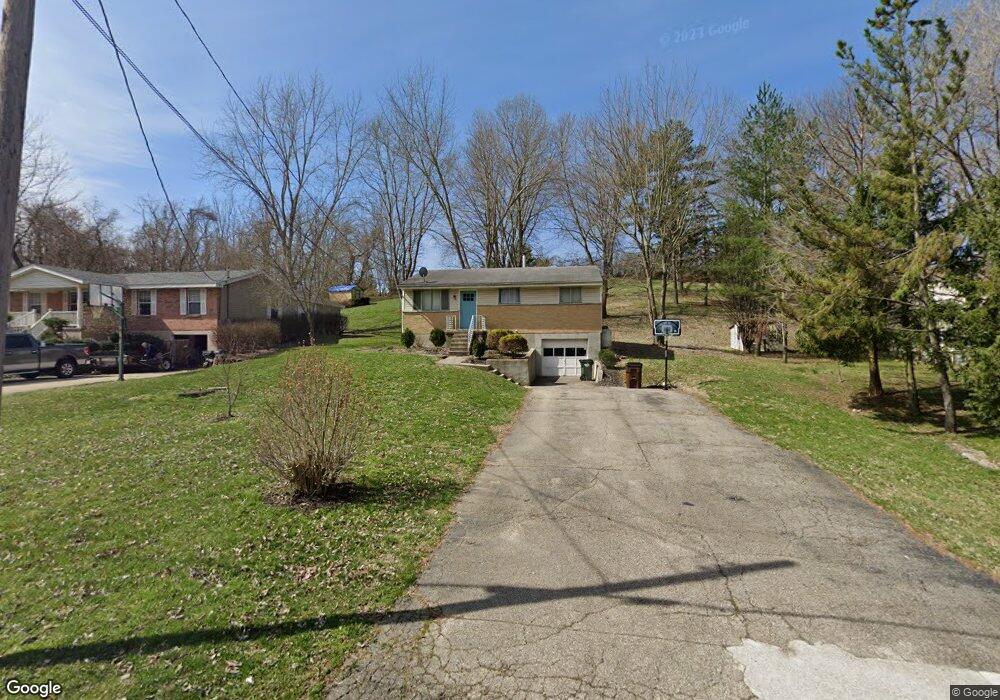
10347 Dugan Gap Rd North Bend, OH 45052
Estimated Value: $161,786 - $248,000
3
Beds
1
Bath
840
Sq Ft
$243/Sq Ft
Est. Value
About This Home
This home is located at 10347 Dugan Gap Rd, North Bend, OH 45052 and is currently estimated at $203,947, approximately $242 per square foot. 10347 Dugan Gap Rd is a home located in Hamilton County with nearby schools including Charles T. Young Elementary School, Taylor Middle School, and Taylor High School.
Ownership History
Date
Name
Owned For
Owner Type
Purchase Details
Closed on
Dec 8, 2016
Sold by
Jackson Ashley and Jackson Michael Jason
Bought by
Jackson Ashley
Current Estimated Value
Home Financials for this Owner
Home Financials are based on the most recent Mortgage that was taken out on this home.
Original Mortgage
$92,694
Outstanding Balance
$74,895
Interest Rate
3.54%
Mortgage Type
FHA
Estimated Equity
$129,052
Purchase Details
Closed on
Jun 17, 2010
Sold by
Duncan Thurman and Duncan Kristin
Bought by
Apostol Ashley
Home Financials for this Owner
Home Financials are based on the most recent Mortgage that was taken out on this home.
Original Mortgage
$100,152
Interest Rate
5.25%
Mortgage Type
FHA
Purchase Details
Closed on
May 15, 1997
Sold by
Fritsch Louise and Duncan Robert
Bought by
Duncan Thurman
Create a Home Valuation Report for This Property
The Home Valuation Report is an in-depth analysis detailing your home's value as well as a comparison with similar homes in the area
Home Values in the Area
Average Home Value in this Area
Purchase History
| Date | Buyer | Sale Price | Title Company |
|---|---|---|---|
| Jackson Ashley | -- | Vantage Point Title | |
| Apostol Ashley | $102,000 | Attorney | |
| Duncan Thurman | -- | -- |
Source: Public Records
Mortgage History
| Date | Status | Borrower | Loan Amount |
|---|---|---|---|
| Open | Jackson Ashley | $92,694 | |
| Closed | Apostol Ashley | $100,152 |
Source: Public Records
Tax History Compared to Growth
Tax History
| Year | Tax Paid | Tax Assessment Tax Assessment Total Assessment is a certain percentage of the fair market value that is determined by local assessors to be the total taxable value of land and additions on the property. | Land | Improvement |
|---|---|---|---|---|
| 2024 | $1,582 | $33,706 | $10,308 | $23,398 |
| 2023 | $1,585 | $33,706 | $10,308 | $23,398 |
| 2022 | $1,885 | $31,441 | $10,220 | $21,221 |
| 2021 | $1,834 | $31,441 | $10,220 | $21,221 |
| 2020 | $1,853 | $31,441 | $10,220 | $21,221 |
| 2019 | $1,682 | $26,422 | $8,589 | $17,833 |
| 2018 | $1,617 | $26,422 | $8,589 | $17,833 |
| 2017 | $1,518 | $26,422 | $8,589 | $17,833 |
| 2016 | $2,124 | $38,199 | $9,191 | $29,008 |
| 2015 | $2,147 | $38,199 | $9,191 | $29,008 |
| 2014 | $2,169 | $38,199 | $9,191 | $29,008 |
| 2013 | $1,986 | $35,700 | $8,589 | $27,111 |
Source: Public Records
Map
Nearby Homes
- 10451 Dugan Gap Rd
- 10651 Brower Rd
- 2700 Rittenhouse Rd
- 9807 Miamiview Rd
- 11225 U S 50
- 36 Timberline Ct
- The Jefferson Plan at North Pointe
- The Bristol Plan at North Pointe
- The Austin Plan at North Pointe
- The Rosewood Plan at North Pointe
- The Ella Marie Plan at North Pointe
- The Lancaster Plan at North Pointe
- The Morgan Plan at North Pointe
- The Madison Plan at North Pointe
- The Mariemont Plan at North Pointe
- The Kendall Plan at North Pointe
- The Avalon Plan at North Pointe
- The Westchester Plan at North Pointe
- The Camden Plan at North Pointe
- The Leighann Plan at North Pointe
- 10341 Dugan Gap Rd
- 10355 Dugan Gap Rd
- 10363 Dugan Gap Rd
- 10356 Dugan Gap Rd
- 10373 Dugan Gap Rd
- 10315 Dugan Gap Rd
- 10307 Dugan Gap Rd
- 10417 Dugan Gap Rd
- 10304 Dugan Gap Rd
- 10380 Dugan Gap Rd
- 10540 Dugan Gap Rd
- 10301 Dugan Gap Rd
- 10388 Dugan Gap Rd
- 10425 Dugan Gap Rd
- 10286 Dugan Gap Rd
- 10276 Dugan Gap Rd
- 10287 Dugan Gap Rd
- 10410 Dugan Gap Rd
- 10310 Dugan Gap Rd
- 10268 Dugan Gap Rd