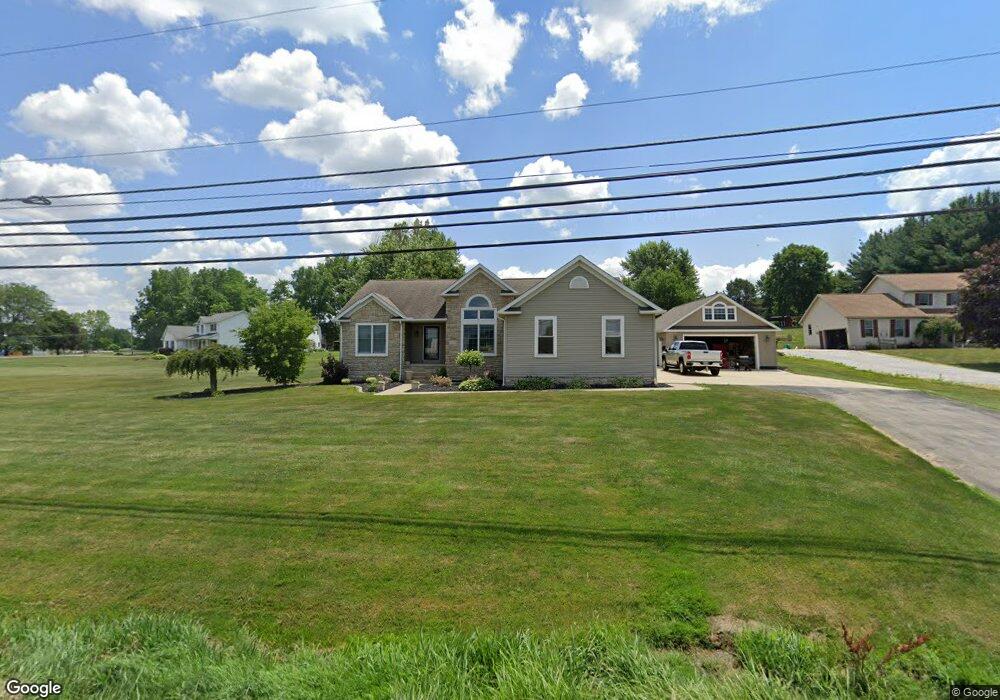
10349 Middlebranch Ave NE Hartville, OH 44632
Estimated Value: $316,000 - $380,000
3
Beds
3
Baths
1,872
Sq Ft
$184/Sq Ft
Est. Value
About This Home
This home is located at 10349 Middlebranch Ave NE, Hartville, OH 44632 and is currently estimated at $345,161, approximately $184 per square foot. 10349 Middlebranch Ave NE is a home located in Stark County with nearby schools including Lake Middle/High School.
Ownership History
Date
Name
Owned For
Owner Type
Purchase Details
Closed on
Jun 5, 2024
Sold by
Larkins Robert D
Bought by
Robert D Larkins Trust and Larkins
Current Estimated Value
Purchase Details
Closed on
Jul 21, 2016
Bought by
Robert D Larkins
Home Financials for this Owner
Home Financials are based on the most recent Mortgage that was taken out on this home.
Interest Rate
3.45%
Purchase Details
Closed on
Feb 23, 1998
Sold by
Windham David T
Bought by
Larkins Robert D and Larkins Sherri L
Home Financials for this Owner
Home Financials are based on the most recent Mortgage that was taken out on this home.
Original Mortgage
$127,500
Interest Rate
6.99%
Mortgage Type
New Conventional
Purchase Details
Closed on
May 3, 1996
Sold by
Miller Paul A
Bought by
Windham David T and Windham Jonette R
Home Financials for this Owner
Home Financials are based on the most recent Mortgage that was taken out on this home.
Original Mortgage
$116,300
Interest Rate
7.86%
Mortgage Type
New Conventional
Create a Home Valuation Report for This Property
The Home Valuation Report is an in-depth analysis detailing your home's value as well as a comparison with similar homes in the area
Home Values in the Area
Average Home Value in this Area
Purchase History
| Date | Buyer | Sale Price | Title Company |
|---|---|---|---|
| Robert D Larkins Trust | -- | None Listed On Document | |
| Robert D Larkins | -- | -- | |
| Larkins Robert D | $150,000 | -- | |
| Windham David T | $20,000 | -- |
Source: Public Records
Mortgage History
| Date | Status | Borrower | Loan Amount |
|---|---|---|---|
| Previous Owner | Robert D Larkins | -- | |
| Previous Owner | Larkins Robert D | $127,500 | |
| Previous Owner | Windham David T | $116,300 |
Source: Public Records
Tax History Compared to Growth
Tax History
| Year | Tax Paid | Tax Assessment Tax Assessment Total Assessment is a certain percentage of the fair market value that is determined by local assessors to be the total taxable value of land and additions on the property. | Land | Improvement |
|---|---|---|---|---|
| 2025 | -- | $109,200 | $22,540 | $86,660 |
| 2024 | -- | $109,200 | $22,540 | $86,660 |
| 2023 | $3,870 | $82,780 | $14,070 | $68,710 |
| 2022 | $3,882 | $82,780 | $14,070 | $68,710 |
| 2021 | $3,927 | $82,780 | $14,070 | $68,710 |
| 2020 | $4,036 | $76,270 | $13,160 | $63,110 |
| 2019 | $3,999 | $76,280 | $13,170 | $63,110 |
| 2018 | $4,001 | $76,280 | $13,170 | $63,110 |
| 2017 | $3,960 | $70,080 | $11,170 | $58,910 |
| 2016 | $3,967 | $70,080 | $11,170 | $58,910 |
| 2015 | $3,964 | $70,080 | $11,170 | $58,910 |
| 2014 | $858 | $52,710 | $9,660 | $43,050 |
| 2013 | $1,429 | $52,710 | $9,660 | $43,050 |
Source: Public Records
Map
Nearby Homes
- 10277 Carlswood Ave NE
- 10387 Middlebranch Ave NE
- 2574 Kim St NE
- 2793 Rita St NE
- 10299 Hunting Hills Ave NE
- 0 Hunting Hills Ave NE
- 3135 Nimishillen Church Rd NE
- 10226 Schlabach Ave NE
- 11121 Geib Ave NE
- 9393 Kent Ave NE
- 1153 Tessa Trail Unit 1153
- 1873 State St NE
- 2231 Lovers Ln NE
- 425 Tonawanda Trail SW
- 8994 Kent Ave NE
- 9790 Smithdale Ave NE
- 177 Woodbury Glen St
- 10277 Market Ave N
- 225 Seneca Trail SW
- 747 Grandview Cir
- 10359 Middlebranch Ave NE
- 10341 Middlebranch Ave NE
- 10320 Wanda Cir NE
- 10344 Middlebranch Ave NE
- 10265 Carlswood Ave NE
- 10296 Wanda Cir NE
- 10289 Carlswood Ave NE
- 10274 Wanda Cir NE
- 10325 Wanda Cir NE
- 10379 Middlebranch Ave NE
- 10276 Carlswood Ave NE
- 10321 Wanda Cir NE
- 10301 Middlebranch Ave NE
- 10305 Wanda Cir NE
- 10290 Carlswood Ave NE
- 10385 Middlebranch Ave NE
- 10233 Carlswood Ave NE
- 10233 Carlswood Ave NE
- 10236 Carlswood Ave NE
- 10289 Wanda Cir NE