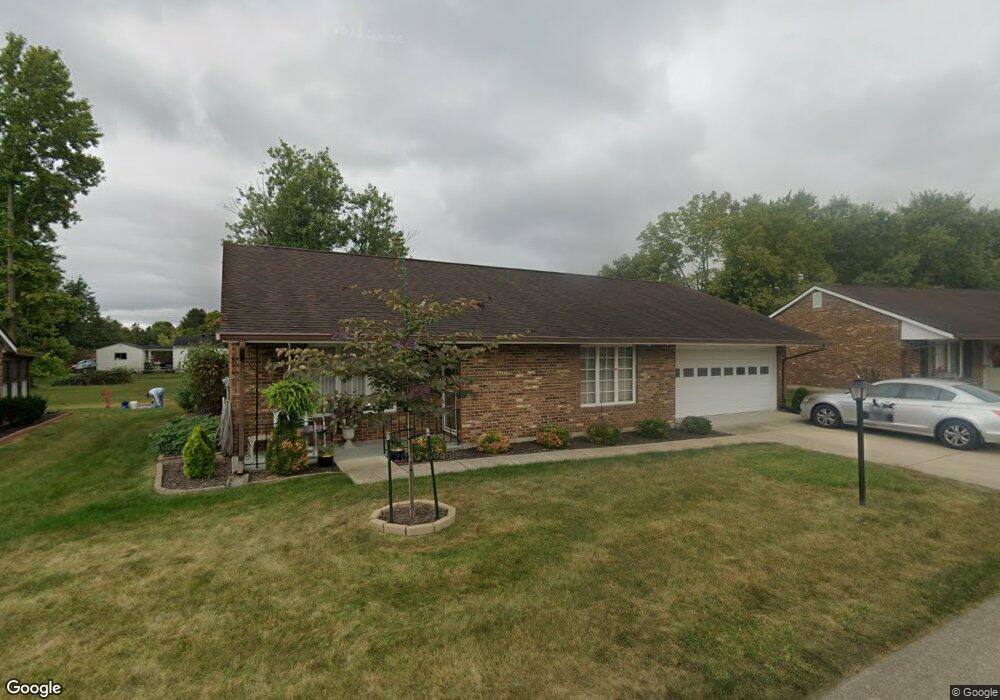
1035 Armsgate Rd Unit 9 Springfield, OH 45503
Estimated Value: $147,000 - $199,000
2
Beds
2
Baths
1,300
Sq Ft
$142/Sq Ft
Est. Value
About This Home
This home is located at 1035 Armsgate Rd Unit 9, Springfield, OH 45503 and is currently estimated at $184,916, approximately $142 per square foot. 1035 Armsgate Rd Unit 9 is a home located in Clark County with nearby schools including Northridge Elementary School, Kenton Ridge Middle & High School, and Emmanuel Christian Academy.
Ownership History
Date
Name
Owned For
Owner Type
Purchase Details
Closed on
Jul 20, 2007
Sold by
Dunham Stephen F
Bought by
Dunham Della Marie
Current Estimated Value
Purchase Details
Closed on
Aug 19, 2005
Sold by
Purk Jean M and Fields Milton L
Bought by
Dunham Stephen F
Home Financials for this Owner
Home Financials are based on the most recent Mortgage that was taken out on this home.
Original Mortgage
$60,500
Interest Rate
5.69%
Mortgage Type
Fannie Mae Freddie Mac
Purchase Details
Closed on
Aug 8, 1997
Sold by
Riley Sally L
Bought by
Purk Jean M
Purchase Details
Closed on
Aug 2, 1996
Sold by
Kintzel Roger S
Bought by
Riley Sally L
Home Financials for this Owner
Home Financials are based on the most recent Mortgage that was taken out on this home.
Original Mortgage
$67,050
Interest Rate
8.33%
Mortgage Type
New Conventional
Create a Home Valuation Report for This Property
The Home Valuation Report is an in-depth analysis detailing your home's value as well as a comparison with similar homes in the area
Home Values in the Area
Average Home Value in this Area
Purchase History
| Date | Buyer | Sale Price | Title Company |
|---|---|---|---|
| Dunham Della Marie | -- | Attorney | |
| Dunham Stephen F | $110,000 | -- | |
| Purk Jean M | $93,000 | -- | |
| Riley Sally L | $74,500 | -- |
Source: Public Records
Mortgage History
| Date | Status | Borrower | Loan Amount |
|---|---|---|---|
| Previous Owner | Dunham Stephen F | $60,500 | |
| Previous Owner | Riley Sally L | $67,050 |
Source: Public Records
Tax History
| Year | Tax Paid | Tax Assessment Tax Assessment Total Assessment is a certain percentage of the fair market value that is determined by local assessors to be the total taxable value of land and additions on the property. | Land | Improvement |
|---|---|---|---|---|
| 2025 | $1,671 | $53,500 | $7,350 | $46,150 |
| 2024 | $847 | $39,380 | $6,300 | $33,080 |
| 2023 | $1,614 | $39,380 | $6,300 | $33,080 |
| 2022 | $1,620 | $39,380 | $6,300 | $33,080 |
| 2021 | $1,431 | $38,470 | $5,250 | $33,220 |
| 2020 | $1,433 | $38,470 | $5,250 | $33,220 |
| 2019 | $1,462 | $38,470 | $5,250 | $33,220 |
| 2018 | $1,130 | $31,050 | $5,570 | $25,480 |
| 2017 | $960 | $30,384 | $5,565 | $24,819 |
| 2016 | $953 | $30,384 | $5,565 | $24,819 |
| 2015 | $853 | $30,069 | $5,250 | $24,819 |
| 2014 | $853 | $30,069 | $5,250 | $24,819 |
| 2013 | $851 | $30,069 | $5,250 | $24,819 |
Source: Public Records
Map
Nearby Homes
- 1039 Bradford Dr Unit 42
- 1139 Bradford Dr
- 3052 Brixton Dr E
- 1136 Foxboro Rd Unit 202
- 3124 El Camino Dr
- 1525 Providence Ave
- 3135 Imperial Blvd
- 1404 Attleboro Ave
- 2943 Tarryton Ln
- 732 Grandview Dr Unit 732
- 2022 Westboro Ave
- 3214 Revels St
- 1201 Kingsgate Rd
- 3631 Kingsgate Ln
- 1162 Kingsgate Rd
- 1500 Kingsgate Rd Unit 19430
- 1502 Kingsgate Rd Unit 19432
- 1500 Kingsgate Rd
- 1502 Kingsgate Rd
- 1507 Kingsgate Rd
- 1037 Armsgate Rd
- 1033 Armsgate Rd
- 1034 Armsgate Rd
- 1036 Armsgate Rd
- 1039 Armsgate Rd Unit 7
- 1031 Armsgate Rd Unit 11
- 1112 Villa Rd
- 1100 Villa Rd
- 1038 Armsgate Rd Unit 33
- 1030 Armsgate Rd Unit 29
- 1030 Armsgate Rd
- 1124 Villa Rd
- 1046 Villa Rd
- 1041 Armsgate Rd Unit 6
- 1041 Armsgate Rd
- 1041 Armsgate Rd
- 1029 Armsgate Rd Unit 12
- 1037 Bradford Dr Unit 43
- 1034 Villa Rd
- 1040 Armsgate Rd Unit 34
Your Personal Tour Guide
Ask me questions while you tour the home.