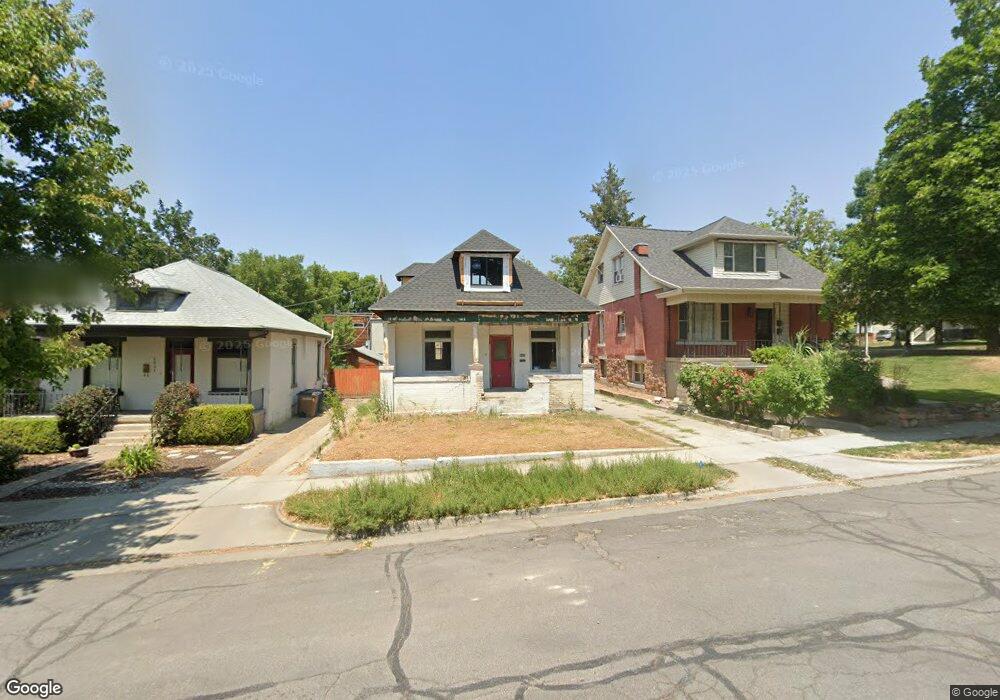
1035 Belmont Ave Salt Lake City, UT 84105
East Central NeighborhoodEstimated Value: $479,000 - $519,681
3
Beds
1
Bath
823
Sq Ft
$609/Sq Ft
Est. Value
About This Home
This home is located at 1035 Belmont Ave, Salt Lake City, UT 84105 and is currently estimated at $501,420, approximately $609 per square foot. 1035 Belmont Ave is a home located in Salt Lake County with nearby schools including Emerson School, Clayton Middle School, and East High School.
Ownership History
Date
Name
Owned For
Owner Type
Purchase Details
Closed on
Oct 10, 2025
Sold by
Demzee Emmanuel L and Mnyavanu Chrispine J
Bought by
Demzee Emmanuel Lungwa
Current Estimated Value
Home Financials for this Owner
Home Financials are based on the most recent Mortgage that was taken out on this home.
Original Mortgage
$757,500
Outstanding Balance
$757,500
Interest Rate
6.56%
Mortgage Type
Construction
Estimated Equity
-$256,080
Purchase Details
Closed on
Aug 8, 2024
Sold by
Littleberg Llc
Bought by
Demzee Emmanuel L and Mnyavanu Chrispine J
Home Financials for this Owner
Home Financials are based on the most recent Mortgage that was taken out on this home.
Original Mortgage
$494,542
Interest Rate
6.86%
Mortgage Type
Construction
Purchase Details
Closed on
Apr 15, 2024
Sold by
Othello Jerol Clark Living Trust and Clark Othello Jerol
Bought by
Littleberg Llc
Purchase Details
Closed on
Jul 7, 2015
Sold by
Clark Othello Jerol
Bought by
Clark Othello Jerol and Othello Jerol Clark Living Trust
Purchase Details
Closed on
Oct 2, 2003
Sold by
Clark Yue Mei
Bought by
Clark Othello Jerol
Create a Home Valuation Report for This Property
The Home Valuation Report is an in-depth analysis detailing your home's value as well as a comparison with similar homes in the area
Home Values in the Area
Average Home Value in this Area
Purchase History
| Date | Buyer | Sale Price | Title Company |
|---|---|---|---|
| Demzee Emmanuel Lungwa | -- | Chicago Title Agency | |
| Demzee Emmanuel L | -- | Paramount Title | |
| Littleberg Llc | -- | Paramount Title | |
| Clark Othello Jerol | -- | None Available | |
| Clark Othello Jerol | -- | -- |
Source: Public Records
Mortgage History
| Date | Status | Borrower | Loan Amount |
|---|---|---|---|
| Open | Demzee Emmanuel Lungwa | $757,500 | |
| Previous Owner | Demzee Emmanuel L | $494,542 |
Source: Public Records
Tax History Compared to Growth
Tax History
| Year | Tax Paid | Tax Assessment Tax Assessment Total Assessment is a certain percentage of the fair market value that is determined by local assessors to be the total taxable value of land and additions on the property. | Land | Improvement |
|---|---|---|---|---|
| 2025 | $2,198 | $393,200 | $218,400 | $174,800 |
| 2024 | $2,198 | $419,700 | $206,600 | $213,100 |
| 2023 | $2,198 | $354,600 | $198,700 | $155,900 |
| 2022 | $2,126 | $366,800 | $194,800 | $172,000 |
| 2021 | $1,900 | $296,900 | $151,100 | $145,800 |
| 2020 | $1,886 | $280,400 | $149,500 | $130,900 |
| 2019 | $1,099 | $273,300 | $140,700 | $132,600 |
| 2018 | $0 | $202,600 | $140,700 | $61,900 |
| 2017 | $88 | $201,400 | $140,700 | $60,700 |
| 2016 | $85 | $189,100 | $103,700 | $85,400 |
| 2015 | $1,669 | $191,700 | $106,900 | $84,800 |
| 2014 | -- | $181,600 | $104,800 | $76,800 |
Source: Public Records
Map
Nearby Homes
- 940 S 1000 E
- 1041 E Yale Ave
- 1041 Yale Ave S
- 823 S 1000 E
- 1120 E Sunnyside Ave
- 1120 E Yale Ave
- 855 E Belmont Ave
- 1031 E 800 S
- 1021 E 800 S
- 1011 E 800 S
- 1099 S 900 E
- 938 E Lowell Ave
- 946 E Princeton Ave
- 1267 Yale Ave S
- 931 Laird Ave S
- 761 S 1200 E
- 1221 E 800 S
- 1216 S 1100 E
- 1013 S 1300 E
- 1117 E 700 S
- 1035 E Belmont Ave
- 1031 Belmont Ave
- 1037 Belmont Ave
- 1031 E Belmont Ave
- 1027 Belmont Ave
- 1027 E Belmont Ave
- 948 Mcclelland St
- 948 S Mcclelland St
- 1017 Belmont Ave
- 1017 E Belmont Ave
- 940 Mcclelland St
- 940 S Mcclelland St
- 1036 E Belmont Ave
- 1036 Belmont Ave
- 1028 E Belmont Ave
- 1028 Belmont Ave
- 961 S Mcclelland St
- 934 Mcclelland St
- 1020 E Belmont Ave
- 1020 Belmont Ave