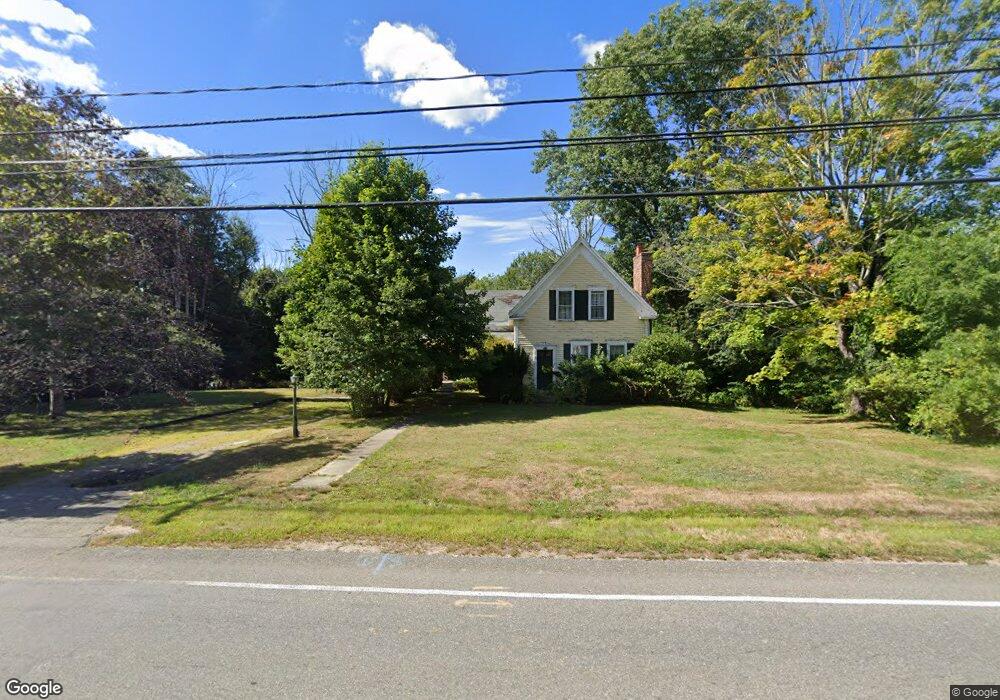
1035 Broadway Hanover, MA 02339
Estimated Value: $555,000 - $713,000
3
Beds
2
Baths
1,438
Sq Ft
$448/Sq Ft
Est. Value
About This Home
This home is located at 1035 Broadway, Hanover, MA 02339 and is currently estimated at $644,898, approximately $448 per square foot. 1035 Broadway is a home located in Plymouth County with nearby schools including Hanover High School, Cadence Academy Preschool - Hanover, and Cardinal Cushing Centers.
Ownership History
Date
Name
Owned For
Owner Type
Purchase Details
Closed on
Jun 26, 1991
Sold by
Sevigny Charles P and Sandra Sevigny W
Bought by
Phillips Daniel J and Phillips Catherine
Current Estimated Value
Home Financials for this Owner
Home Financials are based on the most recent Mortgage that was taken out on this home.
Original Mortgage
$164,000
Interest Rate
9.44%
Mortgage Type
Purchase Money Mortgage
Create a Home Valuation Report for This Property
The Home Valuation Report is an in-depth analysis detailing your home's value as well as a comparison with similar homes in the area
Home Values in the Area
Average Home Value in this Area
Purchase History
| Date | Buyer | Sale Price | Title Company |
|---|---|---|---|
| Phillips Daniel J | $205,000 | -- |
Source: Public Records
Mortgage History
| Date | Status | Borrower | Loan Amount |
|---|---|---|---|
| Closed | Phillips Daniel J | $167,000 | |
| Closed | Phillips Daniel J | $168,000 | |
| Closed | Phillips Daniel J | $164,000 |
Source: Public Records
Tax History
| Year | Tax Paid | Tax Assessment Tax Assessment Total Assessment is a certain percentage of the fair market value that is determined by local assessors to be the total taxable value of land and additions on the property. | Land | Improvement |
|---|---|---|---|---|
| 2025 | $6,906 | $559,200 | $335,600 | $223,600 |
| 2024 | $6,841 | $532,800 | $335,600 | $197,200 |
| 2023 | $6,525 | $483,700 | $305,300 | $178,400 |
| 2022 | $7,108 | $466,100 | $254,400 | $211,700 |
| 2021 | $7,219 | $442,100 | $231,300 | $210,800 |
| 2020 | $7,157 | $438,800 | $231,300 | $207,500 |
| 2019 | $6,817 | $415,400 | $231,300 | $184,100 |
| 2018 | $6,763 | $415,400 | $231,300 | $184,100 |
| 2017 | $6,430 | $389,200 | $236,700 | $152,500 |
| 2016 | $6,092 | $361,300 | $215,100 | $146,200 |
| 2015 | $5,843 | $361,800 | $234,700 | $127,100 |
Source: Public Records
Map
Nearby Homes
- 114 Graham Hill Dr
- 51 Cervelli Farm Dr
- 37 Dr
- 23 Cervelli Farm Dr
- 38 Cervelli Farm Dr
- 9 Cervelli Farm Dr
- 250 Center St
- 35 Sproul Rd
- 70 Bardin St
- 36 Grove St
- 339 State St
- 51 Farmside Dr
- 95 Tecumseh Dr
- 7 Farmside Dr
- 285 W Elm St
- 430 Brook Bend Rd
- 60 Summer Path Way
- 108 Waterford Dr
- 365 Broadway
- 33 1st Parish Ln
Your Personal Tour Guide
Ask me questions while you tour the home.