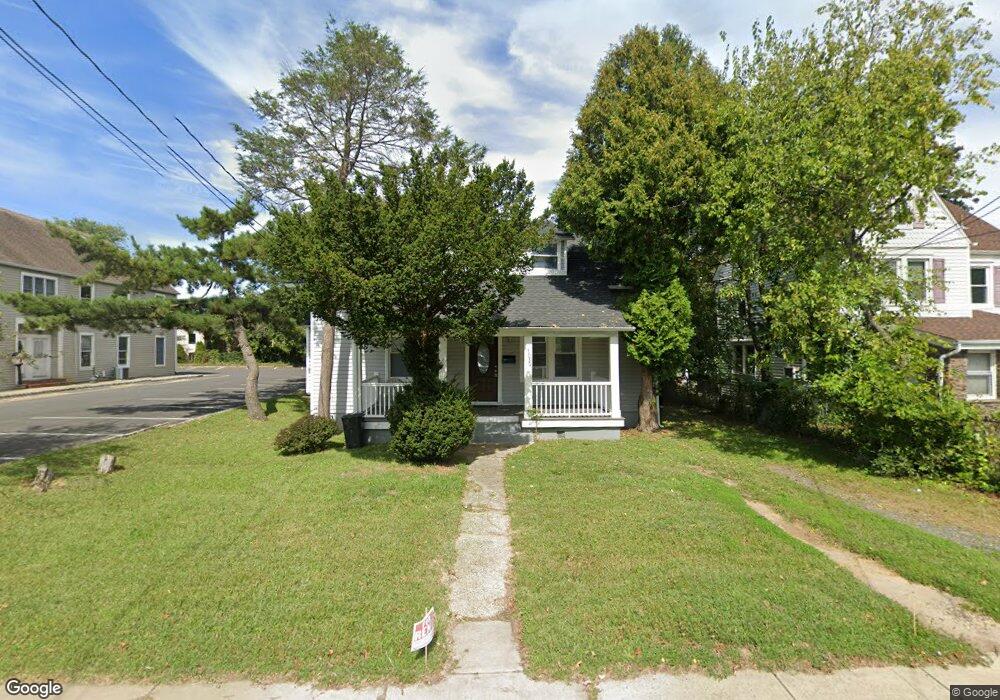
1035 Broadway West Long Branch, NJ 07764
Estimated Value: $585,000 - $625,449
2
Beds
2
Baths
1,239
Sq Ft
$488/Sq Ft
Est. Value
About This Home
This home is located at 1035 Broadway, West Long Branch, NJ 07764 and is currently estimated at $604,112, approximately $487 per square foot. 1035 Broadway is a home located in Monmouth County with nearby schools including Betty McElmon Elementary School, Frank Antonides School, and Shore Regional High School.
Ownership History
Date
Name
Owned For
Owner Type
Purchase Details
Closed on
Sep 6, 2019
Sold by
1035 Broadway Llc
Bought by
G3 Holdings Llc
Current Estimated Value
Purchase Details
Closed on
Sep 27, 2012
Sold by
Gill Bikram
Bought by
1035 Broadway Llc
Purchase Details
Closed on
Sep 17, 2001
Sold by
Schulze Dorothy
Bought by
Gill Bikram
Home Financials for this Owner
Home Financials are based on the most recent Mortgage that was taken out on this home.
Original Mortgage
$124,000
Interest Rate
6.98%
Create a Home Valuation Report for This Property
The Home Valuation Report is an in-depth analysis detailing your home's value as well as a comparison with similar homes in the area
Home Values in the Area
Average Home Value in this Area
Purchase History
| Date | Buyer | Sale Price | Title Company |
|---|---|---|---|
| G3 Holdings Llc | -- | Fidelity National Ttl Ins Co | |
| 1035 Broadway Llc | -- | None Available | |
| Gill Bikram | $155,000 | -- |
Source: Public Records
Mortgage History
| Date | Status | Borrower | Loan Amount |
|---|---|---|---|
| Previous Owner | Gill Bikram | $124,000 |
Source: Public Records
Tax History Compared to Growth
Tax History
| Year | Tax Paid | Tax Assessment Tax Assessment Total Assessment is a certain percentage of the fair market value that is determined by local assessors to be the total taxable value of land and additions on the property. | Land | Improvement |
|---|---|---|---|---|
| 2025 | $7,527 | $574,200 | $293,700 | $280,500 |
| 2024 | $7,104 | $577,700 | $302,400 | $275,300 |
| 2023 | $7,104 | $508,500 | $239,600 | $268,900 |
| 2022 | $7,247 | $448,200 | $192,200 | $256,000 |
| 2021 | $7,247 | $374,900 | $147,200 | $227,700 |
| 2020 | $5,551 | $270,100 | $111,900 | $158,200 |
| 2019 | $5,502 | $269,200 | $111,900 | $157,300 |
| 2018 | $5,732 | $270,900 | $120,900 | $150,000 |
| 2017 | $5,901 | $266,300 | $120,900 | $145,400 |
| 2016 | $5,269 | $242,600 | $123,300 | $119,300 |
| 2015 | $5,211 | $239,600 | $123,300 | $116,300 |
| 2014 | $5,459 | $234,200 | $123,300 | $110,900 |
Source: Public Records
Map
Nearby Homes