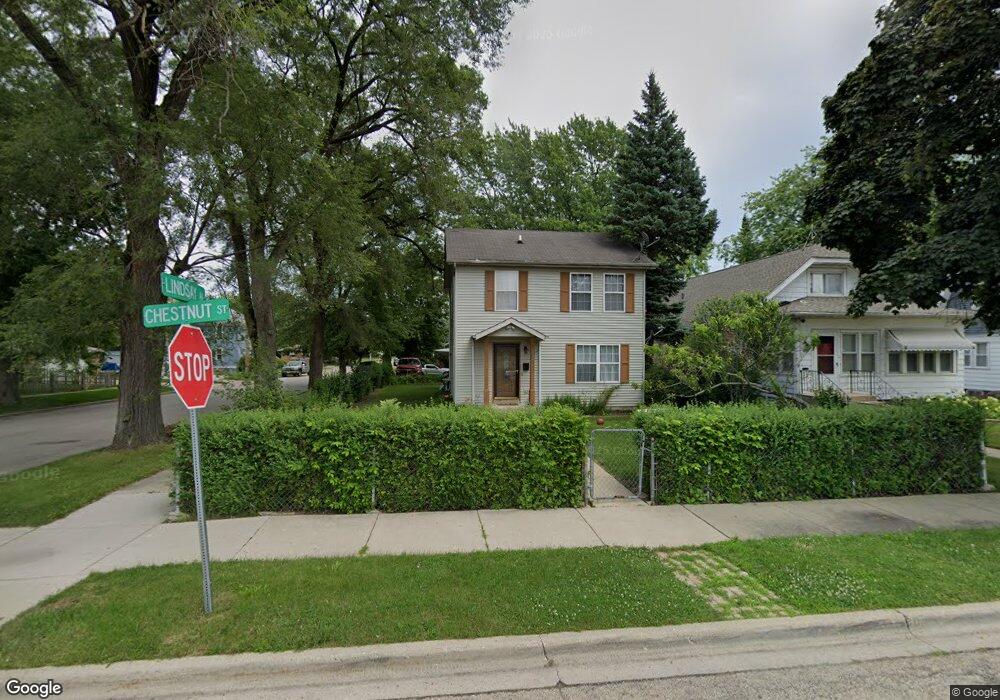
1035 Chestnut St Waukegan, IL 60085
Estimated Value: $244,000 - $325,000
--
Bed
3
Baths
1,248
Sq Ft
$216/Sq Ft
Est. Value
About This Home
This home is located at 1035 Chestnut St, Waukegan, IL 60085 and is currently estimated at $269,502, approximately $215 per square foot. 1035 Chestnut St is a home located in Lake County with nearby schools including Glen Flora Elementary School, Edith M Smith Middle School, and Waukegan High School.
Ownership History
Date
Name
Owned For
Owner Type
Purchase Details
Closed on
Sep 30, 1998
Sold by
Borg Keith L
Bought by
Bernal Francisco and Mendez Paula
Current Estimated Value
Home Financials for this Owner
Home Financials are based on the most recent Mortgage that was taken out on this home.
Original Mortgage
$121,984
Outstanding Balance
$26,869
Interest Rate
6.97%
Mortgage Type
FHA
Estimated Equity
$242,633
Purchase Details
Closed on
Mar 18, 1997
Sold by
Carlson Richard A and Carlson Richard A
Bought by
Borg Keith L
Create a Home Valuation Report for This Property
The Home Valuation Report is an in-depth analysis detailing your home's value as well as a comparison with similar homes in the area
Home Values in the Area
Average Home Value in this Area
Purchase History
| Date | Buyer | Sale Price | Title Company |
|---|---|---|---|
| Bernal Francisco | $123,000 | -- | |
| Borg Keith L | $15,000 | -- |
Source: Public Records
Mortgage History
| Date | Status | Borrower | Loan Amount |
|---|---|---|---|
| Open | Bernal Francisco | $121,984 |
Source: Public Records
Tax History Compared to Growth
Tax History
| Year | Tax Paid | Tax Assessment Tax Assessment Total Assessment is a certain percentage of the fair market value that is determined by local assessors to be the total taxable value of land and additions on the property. | Land | Improvement |
|---|---|---|---|---|
| 2024 | $6,078 | $80,398 | $8,374 | $72,024 |
| 2023 | $6,429 | $72,453 | $7,497 | $64,956 |
| 2022 | $6,429 | $71,759 | $6,239 | $65,520 |
| 2021 | $5,775 | $61,397 | $5,567 | $55,830 |
| 2020 | $5,804 | $57,198 | $5,186 | $52,012 |
| 2019 | $5,788 | $52,413 | $4,752 | $47,661 |
| 2018 | $5,325 | $47,569 | $6,052 | $41,517 |
| 2017 | $5,133 | $42,085 | $5,354 | $36,731 |
| 2016 | $5,651 | $36,570 | $4,652 | $31,918 |
| 2015 | $4,515 | $32,731 | $4,164 | $28,567 |
| 2014 | $4,466 | $32,376 | $4,599 | $27,777 |
| 2012 | $4,489 | $35,077 | $4,983 | $30,094 |
Source: Public Records
Map
Nearby Homes
- 1110 N Ash St
- 918 N Ash St
- 917 N Linden Ave
- 1335 Chestnut St
- 1336 N Ash St
- 415 W Ridgeland Ave
- 1105 Woodlawn Cir
- 1109 Massena Ave
- 1312 N Linden Ave
- 620 N Poplar St
- 1000 Pine St
- 702 Franklin St
- 522 N Poplar St
- 325 4th St
- 824 N Butrick St
- 723 N County St
- 511 Chestnut St
- 428 N Poplar St
- 1504 W Glen Flora Ave
- 1018 W Atlantic Ave
- 1031 Chestnut St
- 1023 Chestnut St
- 1021 Chestnut St
- 1024 N Poplar St
- 1107 Chestnut St
- 1022 N Poplar St
- 1019 Chestnut St
- 1100 N Poplar St
- 1020 N Poplar St
- 1111 Chestnut St
- 1108 N Poplar St
- 1015 Chestnut St
- 1018 N Poplar St
- 1110 N Poplar St
- 1115 Chestnut St
- 1016 N Poplar St
- 1013 Chestnut St
- 1114 N Poplar St
- 1010 N Poplar St