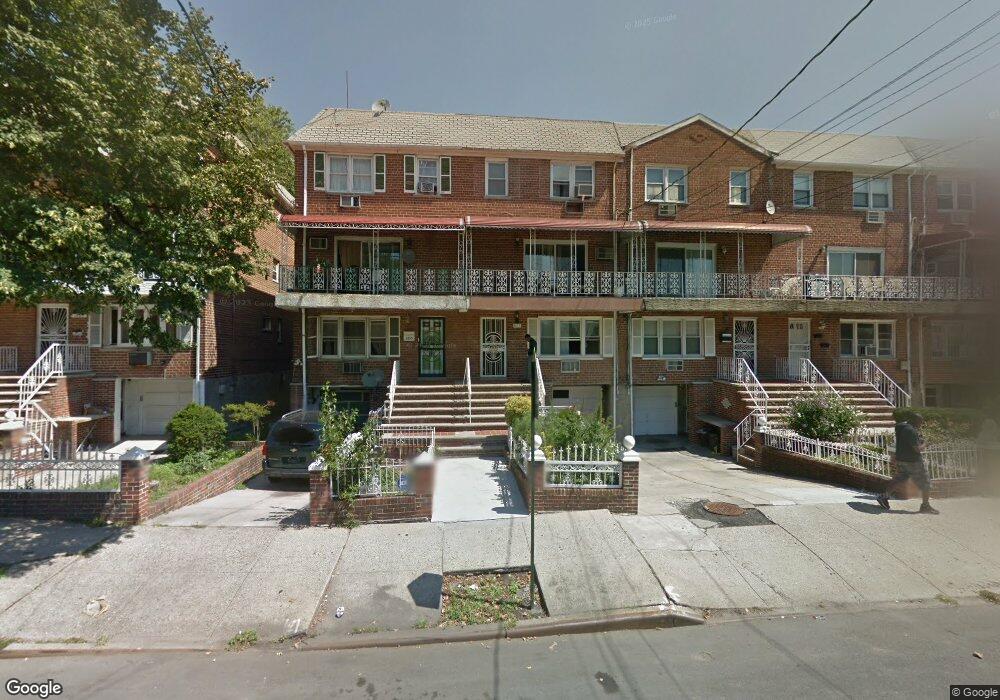
1035 E 80th St Brooklyn, NY 11236
Canarsie NeighborhoodEstimated Value: $803,000 - $1,090,000
Studio
--
Bath
2,760
Sq Ft
$350/Sq Ft
Est. Value
About This Home
This home is located at 1035 E 80th St, Brooklyn, NY 11236 and is currently estimated at $964,935, approximately $349 per square foot. 1035 E 80th St is a home located in Kings County with nearby schools including P.S. 276 Louis Marshall, Is 68 Isaac Bildersee, and Explore Excel Charter School.
Ownership History
Date
Name
Owned For
Owner Type
Purchase Details
Closed on
May 23, 2011
Sold by
Diallo Aissatou
Bought by
Barry Boubacar
Current Estimated Value
Purchase Details
Closed on
Apr 16, 2005
Sold by
Barry Boubacar
Bought by
Diallo Aissatou
Home Financials for this Owner
Home Financials are based on the most recent Mortgage that was taken out on this home.
Original Mortgage
$90,000
Interest Rate
5.83%
Purchase Details
Closed on
Jan 28, 2005
Sold by
Mcintyre Carol and Mcintyre Hyacinth
Bought by
Barry Boubacar
Home Financials for this Owner
Home Financials are based on the most recent Mortgage that was taken out on this home.
Original Mortgage
$90,000
Interest Rate
5.83%
Purchase Details
Closed on
Jun 1, 2000
Sold by
Tabak Julius
Bought by
Mcintyre Carol and Mcintyre Hyacinth
Home Financials for this Owner
Home Financials are based on the most recent Mortgage that was taken out on this home.
Original Mortgage
$288,000
Interest Rate
8.55%
Create a Home Valuation Report for This Property
The Home Valuation Report is an in-depth analysis detailing your home's value as well as a comparison with similar homes in the area
Home Values in the Area
Average Home Value in this Area
Purchase History
| Date | Buyer | Sale Price | Title Company |
|---|---|---|---|
| Barry Boubacar | -- | -- | |
| Barry Boubacar | -- | -- | |
| Diallo Aissatou | -- | -- | |
| Diallo Aissatou | -- | -- | |
| Barry Boubacar | $600,000 | -- | |
| Barry Boubacar | $600,000 | -- | |
| Mcintyre Carol | $325,000 | Fidelity National Title Ins | |
| Mcintyre Carol | $325,000 | Fidelity National Title Ins |
Source: Public Records
Mortgage History
| Date | Status | Borrower | Loan Amount |
|---|---|---|---|
| Previous Owner | Barry Boubacar | $90,000 | |
| Previous Owner | Barry Boubacar | $480,000 | |
| Previous Owner | Mcintyre Carol | $288,000 |
Source: Public Records
Tax History
| Year | Tax Paid | Tax Assessment Tax Assessment Total Assessment is a certain percentage of the fair market value that is determined by local assessors to be the total taxable value of land and additions on the property. | Land | Improvement |
|---|---|---|---|---|
| 2025 | $8,087 | $67,260 | $12,900 | $54,360 |
| 2024 | $8,087 | $72,060 | $12,900 | $59,160 |
| 2023 | $8,115 | $75,300 | $12,900 | $62,400 |
| 2022 | $7,526 | $64,980 | $12,900 | $52,080 |
| 2021 | $7,484 | $54,180 | $12,900 | $41,280 |
| 2020 | $3,510 | $44,220 | $12,900 | $31,320 |
| 2019 | $7,019 | $44,220 | $12,900 | $31,320 |
| 2018 | $6,788 | $33,299 | $9,807 | $23,492 |
| 2017 | $6,404 | $31,415 | $9,127 | $22,288 |
| 2016 | $5,925 | $29,637 | $10,567 | $19,070 |
| 2015 | $4,322 | $27,960 | $11,040 | $16,920 |
| 2014 | $4,322 | $27,960 | $11,040 | $16,920 |
Source: Public Records
Map
Nearby Homes
- 8003 Avenue K
- 1054 E 82nd St
- 8008 Avenue J
- 66 Paerdegat 1st St
- 1123 E 82nd St
- 24 Paerdegat 1st St
- 1027 E 83rd St Unit 2
- 1043 E 84th St
- 1216 E 82nd St Unit 101
- 918 E 81st St
- 17 E 17th St Unit 3B
- 17 E 17th St Unit B3
- 8103 Avenue M Unit 35
- 1204 E 84th St
- 921 E 84th St
- 28 Paerdegat 9th St
- 8317 Flatlands Ave
- 1225 E 85th St
- 923 E 85th St
- 1241 E 85th St
- 1037 E 80th St
- 1031 E 80th St
- 1039 E 80th St
- 1029 E 80th St
- 1039 E 80 St
- 1041 E 80th St Unit ROOM
- 1041 E 80th St
- 1045 E 80th St
- 1025 E 80th St
- 1036 E 81st St
- 1047 E 80th St
- 1032 E 81st St
- 1038 E 81st St
- 1023 E 80th St
- 1030 E 81st St
- 1040 E 81st St
- 1042 E 81st St
- 1028 E 81st St
- 1049 E 80th St
- 1019 E 80th St
Your Personal Tour Guide
Ask me questions while you tour the home.