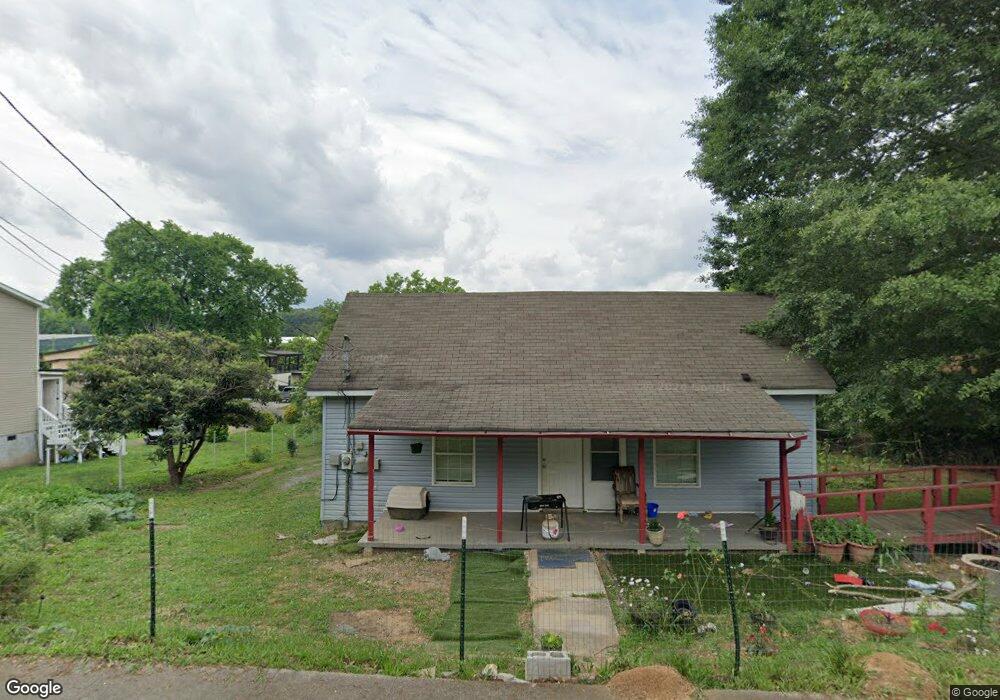
1035 Factory St Dalton, GA 30720
Estimated Value: $152,000 - $182,000
3
Beds
2
Baths
1,101
Sq Ft
$154/Sq Ft
Est. Value
About This Home
This home is located at 1035 Factory St, Dalton, GA 30720 and is currently estimated at $169,867, approximately $154 per square foot. 1035 Factory St is a home located in Whitfield County with nearby schools including City Park Elementary School, Dalton High School, and Rock Hill School.
Ownership History
Date
Name
Owned For
Owner Type
Purchase Details
Closed on
Aug 16, 2023
Sold by
Chavarria Victor M
Bought by
Perez Renardo
Current Estimated Value
Purchase Details
Closed on
Oct 8, 2019
Sold by
Arias Jose Diomedes
Bought by
Perez Renardo Perez
Home Financials for this Owner
Home Financials are based on the most recent Mortgage that was taken out on this home.
Original Mortgage
$115,430
Interest Rate
3.5%
Mortgage Type
New Conventional
Purchase Details
Closed on
Apr 14, 2011
Sold by
Federal National Mortgage Association
Bought by
Arias Jose Diomedes
Purchase Details
Closed on
Sep 18, 2003
Sold by
Gowan Properties Inc
Bought by
Zuniga Rigoberto
Purchase Details
Closed on
Jul 27, 2001
Sold by
Gowan Jeff E
Bought by
Gowan Properties Inc
Purchase Details
Closed on
Feb 1, 1995
Bought by
Gowan Jeff E
Create a Home Valuation Report for This Property
The Home Valuation Report is an in-depth analysis detailing your home's value as well as a comparison with similar homes in the area
Purchase History
| Date | Buyer | Sale Price | Title Company |
|---|---|---|---|
| Perez Renardo | $115,000 | None Listed On Document | |
| Perez Renardo Perez | $119,000 | -- | |
| Arias Jose Diomedes | $22,500 | -- | |
| Zuniga Rigoberto | $80,000 | -- | |
| Gowan Properties Inc | -- | -- | |
| Gowan Jeff E | $45,000 | -- |
Source: Public Records
Mortgage History
| Date | Status | Borrower | Loan Amount |
|---|---|---|---|
| Previous Owner | Perez Renardo Perez | $115,430 |
Source: Public Records
Tax History
| Year | Tax Paid | Tax Assessment Tax Assessment Total Assessment is a certain percentage of the fair market value that is determined by local assessors to be the total taxable value of land and additions on the property. | Land | Improvement |
|---|---|---|---|---|
| 2025 | $1,898 | $62,900 | $8,400 | $54,500 |
| 2024 | $1,898 | $62,900 | $8,400 | $54,500 |
| 2023 | $1,464 | $39,648 | $6,000 | $33,648 |
| 2022 | $898 | $26,061 | $4,998 | $21,063 |
| 2021 | $899 | $26,061 | $4,998 | $21,063 |
| 2020 | $934 | $26,061 | $4,998 | $21,063 |
| 2019 | $963 | $26,061 | $4,998 | $21,063 |
| 2018 | $977 | $26,061 | $4,998 | $21,063 |
| 2017 | $941 | $26,061 | $4,998 | $21,063 |
| 2016 | $877 | $24,155 | $4,998 | $19,157 |
| 2014 | $568 | $24,155 | $4,998 | $19,157 |
| 2013 | -- | $24,155 | $4,998 | $19,157 |
Source: Public Records
Map
Nearby Homes
- 1380 Lida St
- Lot 4 0 Point North Place
- 1310 Cleo Way
- 1129 N Hamilton St
- 1402 Elite Dr
- 0 Trammell St
- 103 Edgewood Ave
- 902 Cascade Dr Unit 5
- 1119 Acme St
- 727 W Tyler St
- 509 N Hamilton St
- 1613 Broadrick Dr
- 00 Glenwood Ave
- 504 W Boundary St
- 708 Clark St
- 303 Crystal Place
- 1103 Manly St
- 928 Avenue C
- 303 Smith St
- 1414 Walston Ave
- 1031 Factory St
- 1039 Factory St
- 1027 Candlewick Ct
- 1029 Candlewick Ct
- 46 Mountain View
- 1027 Factory St
- 1043 Factory St
- 1034 Factory St
- 1036 Factory St
- 1030 Factory St
- 39A Mountain View St
- 1040 Factory St
- 1020 Chattanooga Ave
- 1026 Factory St
- 1023 Factory St
- 1045 Factory St
- 1046 Factory St
- 1022 Factory St
- 1021 Factory St
- 1048 Factory St
Your Personal Tour Guide
Ask me questions while you tour the home.