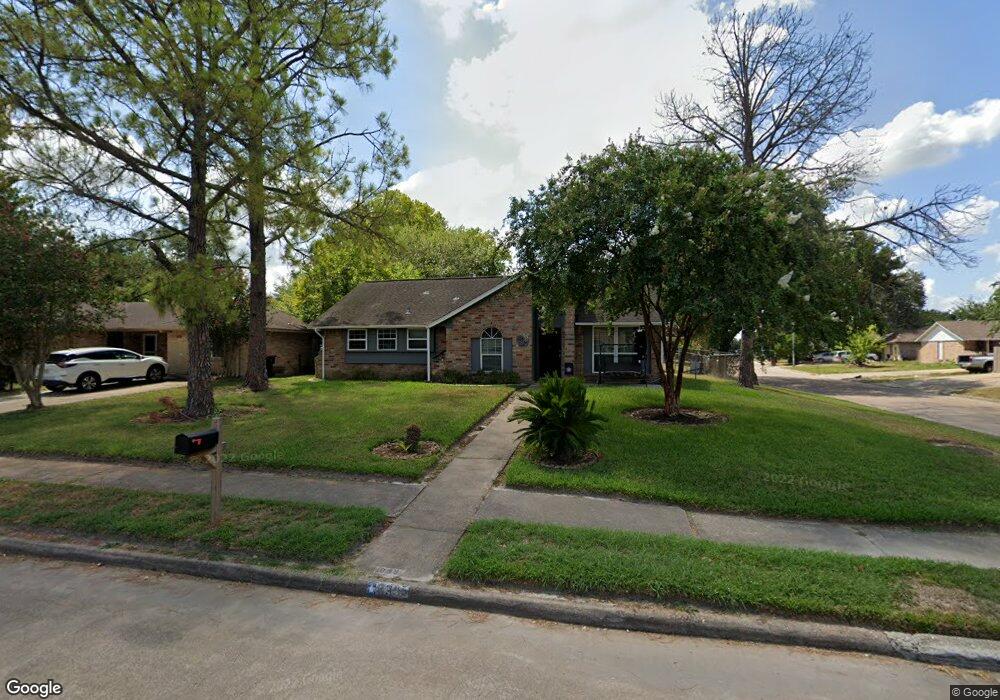
1035 Fallbrook Dr Houston, TX 77038
North Houston NeighborhoodEstimated Value: $205,000 - $237,000
4
Beds
2
Baths
1,448
Sq Ft
$153/Sq Ft
Est. Value
About This Home
This home is located at 1035 Fallbrook Dr, Houston, TX 77038 and is currently estimated at $221,428, approximately $152 per square foot. 1035 Fallbrook Dr is a home located in Harris County with nearby schools including Jerry Keeble Ec/Pre-K, Gray Elementary School, and Stovall Middle School.
Ownership History
Date
Name
Owned For
Owner Type
Purchase Details
Closed on
Jul 27, 2009
Sold by
Salazar Roger
Bought by
Campos Jose
Current Estimated Value
Home Financials for this Owner
Home Financials are based on the most recent Mortgage that was taken out on this home.
Original Mortgage
$97,744
Outstanding Balance
$65,335
Interest Rate
5.71%
Mortgage Type
VA
Estimated Equity
$156,093
Purchase Details
Closed on
Feb 17, 2009
Sold by
Wells Fargo Bank Na
Bought by
Salazar Roger
Purchase Details
Closed on
Aug 5, 2008
Sold by
Flores Jesus and Flores Georgina Sanchez
Bought by
Wells Fargo Bank Na and Asset Backed Pass Through Certificates S
Purchase Details
Closed on
Jun 14, 2005
Sold by
Barron Esther Alva
Bought by
Flores Jesus
Home Financials for this Owner
Home Financials are based on the most recent Mortgage that was taken out on this home.
Original Mortgage
$86,685
Interest Rate
9.32%
Mortgage Type
Fannie Mae Freddie Mac
Create a Home Valuation Report for This Property
The Home Valuation Report is an in-depth analysis detailing your home's value as well as a comparison with similar homes in the area
Home Values in the Area
Average Home Value in this Area
Purchase History
| Date | Buyer | Sale Price | Title Company |
|---|---|---|---|
| Campos Jose | -- | First American Title | |
| Salazar Roger | -- | None Available | |
| Wells Fargo Bank Na | $90,018 | None Available | |
| Flores Jesus | -- | Southern American Title West |
Source: Public Records
Mortgage History
| Date | Status | Borrower | Loan Amount |
|---|---|---|---|
| Open | Campos Jose | $97,744 | |
| Previous Owner | Flores Jesus | $86,685 |
Source: Public Records
Tax History Compared to Growth
Tax History
| Year | Tax Paid | Tax Assessment Tax Assessment Total Assessment is a certain percentage of the fair market value that is determined by local assessors to be the total taxable value of land and additions on the property. | Land | Improvement |
|---|---|---|---|---|
| 2025 | $2,164 | $214,933 | $33,135 | $181,798 |
| 2024 | $2,164 | $214,933 | $33,135 | $181,798 |
| 2023 | $2,164 | $214,933 | $33,135 | $181,798 |
| 2022 | $3,372 | $171,255 | $27,612 | $143,643 |
| 2021 | $3,197 | $144,840 | $27,612 | $117,228 |
| 2020 | $3,095 | $139,289 | $27,612 | $111,677 |
| 2019 | $2,926 | $128,472 | $27,612 | $100,860 |
| 2018 | $1,078 | $120,661 | $12,669 | $107,992 |
| 2017 | $2,343 | $120,661 | $12,669 | $107,992 |
| 2016 | $2,130 | $99,909 | $12,669 | $87,240 |
| 2015 | $1,430 | $99,909 | $12,669 | $87,240 |
| 2014 | $1,430 | $82,793 | $12,669 | $70,124 |
Source: Public Records
Map
Nearby Homes
- 1019 Castolan Dr
- 939 Point Blank Dr
- 1022 Progreso Dr
- 10519 Pleasanton Dr
- 1219 Pilot Point Dr
- 1138 Cherry Spring Dr
- 1010 Francitas Dr
- 1327 Fallbrook Dr
- 10558 Pleasanton Dr
- 10226 Ella Falls Blvd
- 1006 Fruitvale Dr
- 00 Fallbrook Dr
- 1506 Wilshire Park Dr
- 10134 Lasaber Ct
- 0 W Mt Houston Rd Unit 90464120
- 10026 Lasaber Ct
- 2115 Havencrest Dr
- 2203 Chalet Rd
- 12718 Sai Baba Dr
- 2614 Lemonwood Ln
- 1031 Fallbrook Dr
- 10326 Pleasanton Dr
- 1103 Fallbrook Dr
- 1027 Fallbrook Dr
- 10327 Pleasanton Dr
- 10322 Pleasanton Dr
- 10311 Saber Ct
- 1023 Fallbrook Dr
- 1107 Fallbrook Dr
- 1034 Fallbrook Dr
- 0 Fallbrook Drive Home Houston (Id 985) Unit 7619106-11368173
- 1030 Fallbrook Dr
- 10323 Pleasanton Dr
- 10307 Saber Ct
- 1102 Fallbrook Dr
- 1026 Fallbrook Dr
- 1019 Fallbrook Dr
- 10318 Pleasanton Dr
- 1111 Fallbrook Dr
- 1106 Fallbrook Dr