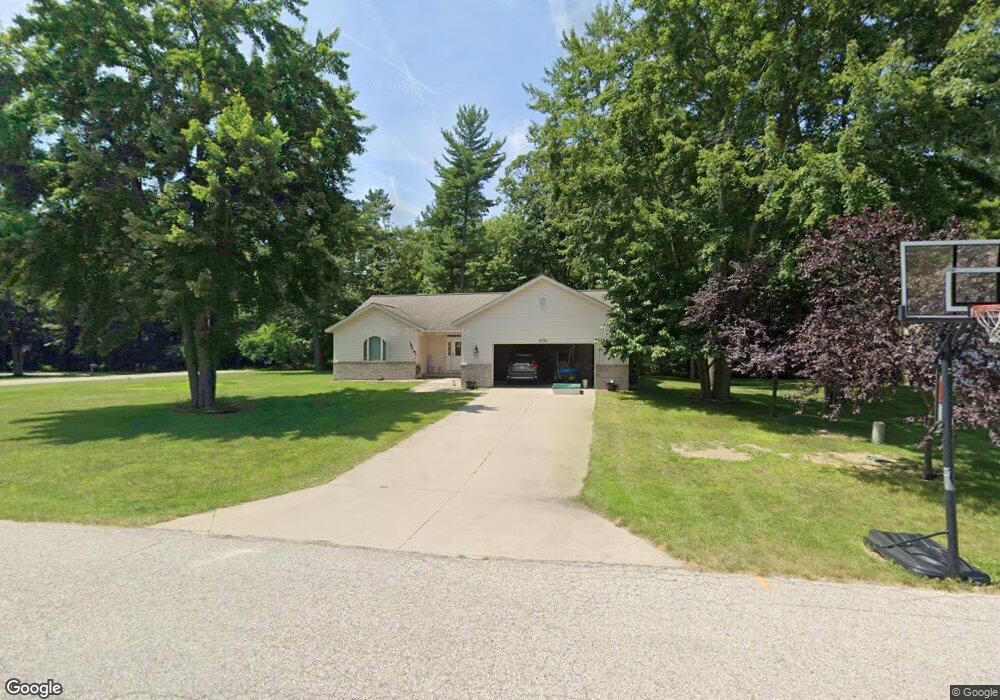
1035 Glen View Dr Unit 23 Muskegon, MI 49445
Estimated Value: $367,753 - $480,000
3
Beds
2
Baths
1,772
Sq Ft
$243/Sq Ft
Est. Value
About This Home
This home is located at 1035 Glen View Dr Unit 23, Muskegon, MI 49445 and is currently estimated at $430,188, approximately $242 per square foot. 1035 Glen View Dr Unit 23 is a home located in Muskegon County with nearby schools including Reeths-Puffer High School.
Ownership History
Date
Name
Owned For
Owner Type
Purchase Details
Closed on
Oct 16, 2009
Sold by
Jack Workman Inc
Bought by
Ruiz Jason F and Ruiz Jennifer L
Current Estimated Value
Home Financials for this Owner
Home Financials are based on the most recent Mortgage that was taken out on this home.
Original Mortgage
$179,204
Outstanding Balance
$116,958
Interest Rate
5.07%
Mortgage Type
FHA
Estimated Equity
$313,230
Purchase Details
Closed on
Jun 16, 2009
Sold by
Durow Douglas D and Durow Joann T
Bought by
Workman Jack A and Workman Bonny B
Purchase Details
Closed on
Aug 27, 2007
Sold by
Jack Workman Inc
Bought by
Durow Douglas D and Durow Joann T
Purchase Details
Closed on
Mar 29, 2004
Sold by
Jones Diane
Bought by
Jask Workman Inc
Purchase Details
Closed on
Oct 17, 2003
Sold by
Jones Diane
Bought by
Fifth Third Bank
Create a Home Valuation Report for This Property
The Home Valuation Report is an in-depth analysis detailing your home's value as well as a comparison with similar homes in the area
Home Values in the Area
Average Home Value in this Area
Purchase History
| Date | Buyer | Sale Price | Title Company |
|---|---|---|---|
| Ruiz Jason F | -- | None Available | |
| Jack Workman Inc | -- | None Available | |
| Workman Jack A | -- | None Available | |
| Durow Douglas D | -- | None Available | |
| Jask Workman Inc | $43,500 | -- | |
| Fifth Third Bank | $40,025 | -- |
Source: Public Records
Mortgage History
| Date | Status | Borrower | Loan Amount |
|---|---|---|---|
| Open | Ruiz Jason F | $179,204 |
Source: Public Records
Tax History Compared to Growth
Tax History
| Year | Tax Paid | Tax Assessment Tax Assessment Total Assessment is a certain percentage of the fair market value that is determined by local assessors to be the total taxable value of land and additions on the property. | Land | Improvement |
|---|---|---|---|---|
| 2025 | $3,545 | $135,700 | $0 | $0 |
| 2024 | $1,250 | $141,200 | $0 | $0 |
| 2023 | $1,196 | $126,000 | $0 | $0 |
| 2022 | $3,219 | $112,900 | $0 | $0 |
| 2021 | $3,187 | $101,700 | $0 | $0 |
| 2020 | $3,099 | $99,100 | $0 | $0 |
| 2019 | $3,019 | $96,200 | $0 | $0 |
| 2018 | $2,981 | $97,700 | $0 | $0 |
| 2017 | $3,856 | $96,600 | $0 | $0 |
| 2016 | $1,019 | $90,200 | $0 | $0 |
| 2015 | -- | $92,900 | $0 | $0 |
| 2014 | -- | $90,000 | $0 | $0 |
| 2013 | -- | $82,500 | $0 | $0 |
Source: Public Records
Map
Nearby Homes
- 1709 Hampstead Dr
- 1596 Nottingham Ct
- 1513 W Addison Way Unit 28
- 780 Horton Rd
- 1516 W Addison Way Unit 54
- 0 Horton Rd Unit 25046889
- V/L W Giles Rd
- 421 W Chadwick Dr
- 1045 Greenbriar Dr
- 1310 W Giles Rd
- 1641 N Buys Rd
- 1616 Westwind Ct
- 1463 Glenwood Ave
- 1499 Glenwood Ave
- 1234 W Giles Rd
- 1601 Westwind Ct
- 1141 N Robinhood Dr
- 1741 Hansen St
- 2055 Horton Rd
- 2855 Fenner Rd
- 1055 Glen View Dr
- 1976 Dykstra Rd
- 1052 Glen View Dr Unit 58
- 1084 Glen View Dr
- 1068 Glen View Dr Unit 57
- 1995 Dykstra Rd Unit 21
- 1956 Dykstra Rd
- 2073 Dykstra Rd Unit 22
- 1977 Dykstra Rd
- 1093 Glen View Dr
- 1053 Dykstra Ct
- 1959 Dykstra Rd
- 1936 Dykstra Rd
- 1113 Glen View Dr
- 1065 Dykstra Ct
- 1965 Fenner Glen Dr
- 1939 Dykstra Rd Unit 18
- 1943 Fenner Glen Dr
- 1068 Dykstra Ct Unit 64
- 1127 Glen View Dr