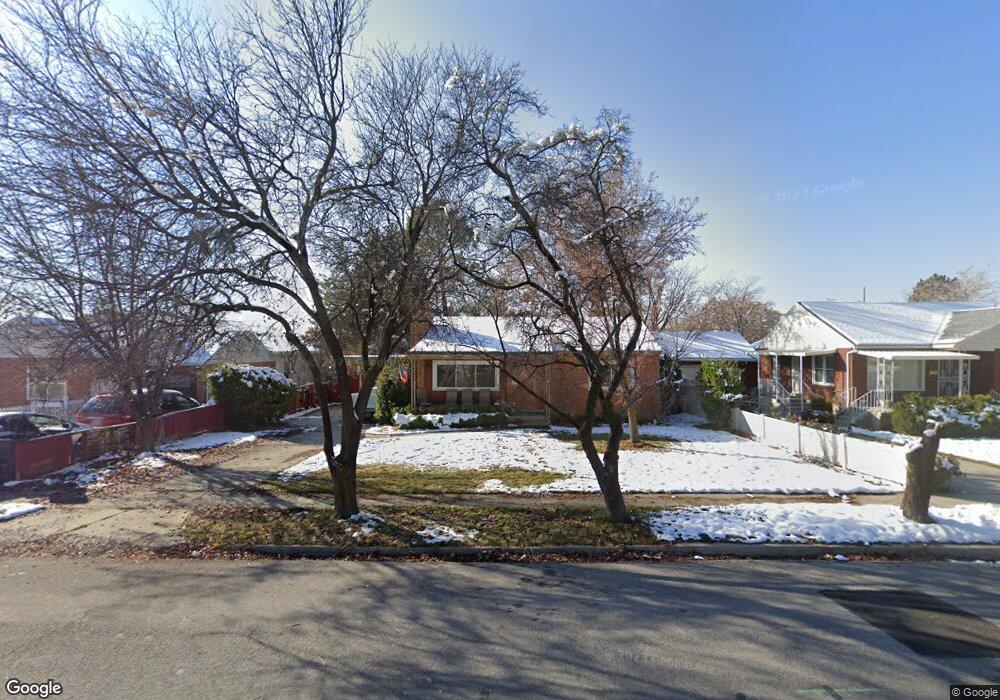
1035 N 100 W Pleasant Grove, UT 84062
Estimated Value: $452,000 - $570,000
3
Beds
2
Baths
1,875
Sq Ft
$262/Sq Ft
Est. Value
About This Home
This home is located at 1035 N 100 W, Pleasant Grove, UT 84062 and is currently estimated at $490,968, approximately $261 per square foot. 1035 N 100 W is a home located in Utah County with nearby schools including Mount Mahogany School, Pleasant Grove Junior High School, and Pleasant Grove High School.
Ownership History
Date
Name
Owned For
Owner Type
Purchase Details
Closed on
Apr 24, 2013
Sold by
Cook Clint
Bought by
Kelley Adam and Kelley Julie
Current Estimated Value
Home Financials for this Owner
Home Financials are based on the most recent Mortgage that was taken out on this home.
Original Mortgage
$168,884
Outstanding Balance
$118,668
Interest Rate
3.37%
Mortgage Type
FHA
Estimated Equity
$372,300
Purchase Details
Closed on
Mar 17, 2006
Sold by
Cook Darrell J and Estate Of Beth Wanlass Cook
Bought by
Cook Clint
Home Financials for this Owner
Home Financials are based on the most recent Mortgage that was taken out on this home.
Original Mortgage
$133,119
Interest Rate
6.19%
Mortgage Type
FHA
Purchase Details
Closed on
Jan 12, 2004
Sold by
Cook Jack E and Cook Beth W
Bought by
Cook Beth W
Create a Home Valuation Report for This Property
The Home Valuation Report is an in-depth analysis detailing your home's value as well as a comparison with similar homes in the area
Home Values in the Area
Average Home Value in this Area
Purchase History
| Date | Buyer | Sale Price | Title Company |
|---|---|---|---|
| Kelley Adam | -- | First American Title Co Llc | |
| Cook Clint | -- | Backman Title Services Ltd | |
| Cook Beth W | -- | Mountain West Title Co |
Source: Public Records
Mortgage History
| Date | Status | Borrower | Loan Amount |
|---|---|---|---|
| Open | Kelley Adam | $168,884 | |
| Previous Owner | Cook Clint | $133,119 |
Source: Public Records
Tax History Compared to Growth
Tax History
| Year | Tax Paid | Tax Assessment Tax Assessment Total Assessment is a certain percentage of the fair market value that is determined by local assessors to be the total taxable value of land and additions on the property. | Land | Improvement |
|---|---|---|---|---|
| 2025 | $1,870 | $245,850 | $219,600 | $227,400 |
| 2024 | $1,870 | $218,185 | $0 | $0 |
| 2023 | $1,740 | $212,630 | $0 | $0 |
| 2022 | $1,907 | $231,770 | $0 | $0 |
| 2021 | $1,643 | $304,200 | $157,600 | $146,600 |
| 2020 | $1,510 | $274,000 | $140,700 | $133,300 |
| 2019 | $1,306 | $245,100 | $129,200 | $115,900 |
| 2018 | $1,265 | $224,500 | $117,900 | $106,600 |
| 2017 | $1,116 | $105,380 | $0 | $0 |
| 2016 | $1,089 | $99,330 | $0 | $0 |
| 2015 | $1,150 | $99,330 | $0 | $0 |
| 2014 | $1,147 | $98,120 | $0 | $0 |
Source: Public Records
Map
Nearby Homes
- 1152 N 200 W
- 685 W 1000 N
- 344 E 900 N
- 825 N 350 E
- 1051 N 600 W
- 1031 N 600 W
- 1041 N 600 W
- 1656 N Siena Cir Unit 7
- 1727 N Siena Cir Unit 4
- 1726 N Siena Cir Unit 10
- 405 N 200 E
- 1534 N 750 W Unit 16
- 731 W 1590 N Unit 15
- 909 W 1180 N
- Konlee Plan at Makin Dreams
- Alexa Plan at Makin Dreams
- Callahan Plan at Makin Dreams
- Hailey Plan at Makin Dreams
- Alydia Plan at Makin Dreams
- Addison Plan at Makin Dreams