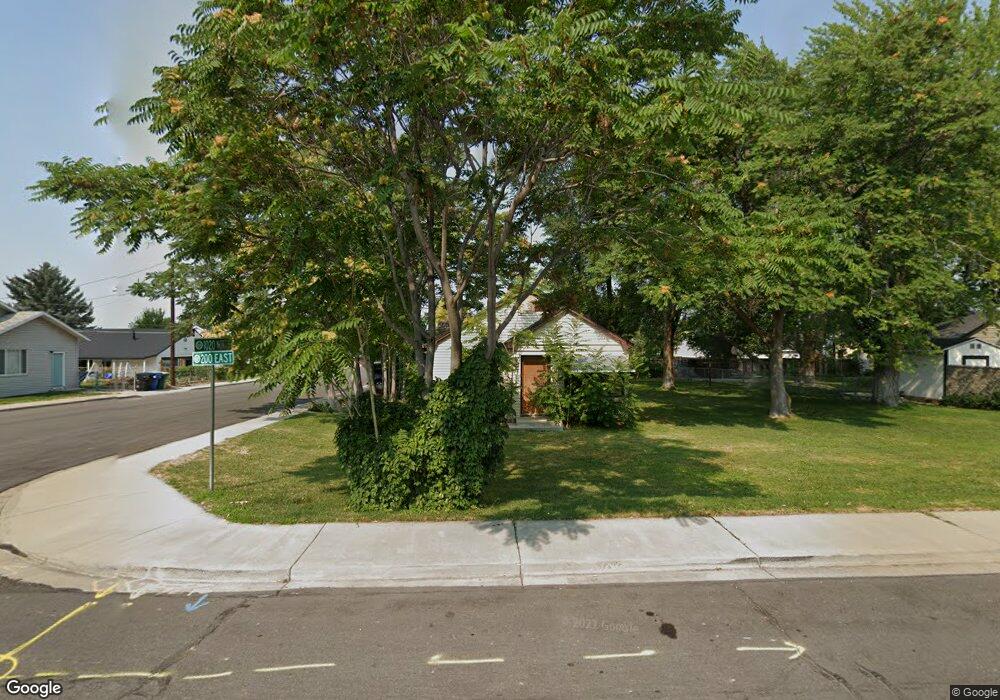
1035 N 200 E Orem, UT 84057
Windsor NeighborhoodEstimated Value: $426,000 - $502,000
2
Beds
2
Baths
953
Sq Ft
$487/Sq Ft
Est. Value
About This Home
This home is located at 1035 N 200 E, Orem, UT 84057 and is currently estimated at $464,117, approximately $487 per square foot. 1035 N 200 E is a home located in Utah County with nearby schools including Orchard Elementary School, Canyon View Junior High School, and Timpanogos High School.
Ownership History
Date
Name
Owned For
Owner Type
Purchase Details
Closed on
Jan 14, 2015
Sold by
Holdaway Brian and Holdaway Kregg
Bought by
Holdaway Nan and Jorgensen Rebecca Kay
Current Estimated Value
Purchase Details
Closed on
Jan 9, 2015
Sold by
Orton B Richard and The Holdaway Family Living Tru
Bought by
Holdaway Brian and Holdaway Kregg
Purchase Details
Closed on
Mar 20, 2014
Sold by
Holdaway Tina
Bought by
Orton B Richard and The Holdaway Family Living Tru
Purchase Details
Closed on
Mar 14, 2014
Sold by
Orton B Richard and The Holdaway Family Living Tru
Bought by
Holdaway Tina
Purchase Details
Closed on
May 2, 2003
Sold by
Gray Stephen B and Gray Cody L
Bought by
Holdaway M Kay M and Holdaway Lynda Kaye
Purchase Details
Closed on
Nov 27, 2000
Sold by
Thacker Berneice K and Thacker Allan Dale
Bought by
Gray Stephen B and Gray Cody L
Home Financials for this Owner
Home Financials are based on the most recent Mortgage that was taken out on this home.
Original Mortgage
$97,000
Interest Rate
7.86%
Create a Home Valuation Report for This Property
The Home Valuation Report is an in-depth analysis detailing your home's value as well as a comparison with similar homes in the area
Home Values in the Area
Average Home Value in this Area
Purchase History
| Date | Buyer | Sale Price | Title Company |
|---|---|---|---|
| Holdaway Nan | -- | North American Title | |
| Holdaway Brian | -- | North American Title | |
| Orton B Richard | -- | Accommodation | |
| Holdaway Tina | -- | North American Title | |
| Holdaway M Kay M | -- | Affiliated First Title | |
| Gray Stephen B | -- | Titlewriters Inc |
Source: Public Records
Mortgage History
| Date | Status | Borrower | Loan Amount |
|---|---|---|---|
| Previous Owner | Gray Stephen B | $97,000 |
Source: Public Records
Tax History
| Year | Tax Paid | Tax Assessment Tax Assessment Total Assessment is a certain percentage of the fair market value that is determined by local assessors to be the total taxable value of land and additions on the property. | Land | Improvement |
|---|---|---|---|---|
| 2025 | $1,757 | $239,305 | -- | -- |
| 2024 | $1,757 | $214,830 | $0 | $0 |
| 2023 | $1,593 | $209,385 | $0 | $0 |
| 2022 | $1,711 | $217,910 | $0 | $0 |
| 2021 | $1,382 | $266,600 | $150,300 | $116,300 |
| 2020 | $1,236 | $234,200 | $120,200 | $114,000 |
| 2019 | $1,071 | $211,000 | $109,000 | $102,000 |
| 2018 | $1,038 | $195,400 | $105,200 | $90,200 |
| 2017 | $962 | $97,075 | $0 | $0 |
| 2016 | $922 | $85,745 | $0 | $0 |
| 2015 | $863 | $75,955 | $0 | $0 |
| 2014 | $793 | $69,410 | $0 | $0 |
Source: Public Records
Map
Nearby Homes
Your Personal Tour Guide
Ask me questions while you tour the home.