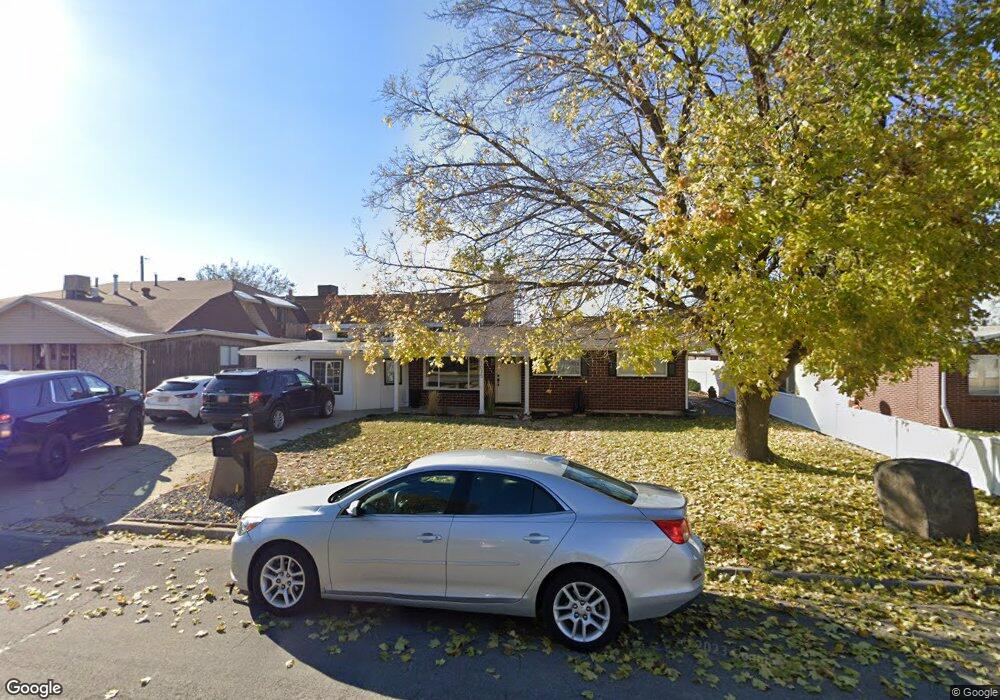
1035 N 400 W Bountiful, UT 84010
Estimated Value: $463,000 - $496,000
3
Beds
2
Baths
1,700
Sq Ft
$282/Sq Ft
Est. Value
About This Home
This home is located at 1035 N 400 W, Bountiful, UT 84010 and is currently estimated at $479,200, approximately $281 per square foot. 1035 N 400 W is a home located in Davis County with nearby schools including Meadowbrook Elementary School, Bountiful Junior High School, and Viewmont High School.
Ownership History
Date
Name
Owned For
Owner Type
Purchase Details
Closed on
Mar 3, 2023
Sold by
Jackson Jeff Taylor and Jackson Caitlynn
Bought by
Geoghegan William Sean
Current Estimated Value
Home Financials for this Owner
Home Financials are based on the most recent Mortgage that was taken out on this home.
Original Mortgage
$446,758
Outstanding Balance
$431,773
Interest Rate
6.15%
Mortgage Type
FHA
Estimated Equity
$47,427
Purchase Details
Closed on
Nov 20, 2019
Sold by
Banford Eric D and Dole Megan J
Bought by
Jackson Jeff Taylor and Jackson Caitlynn
Home Financials for this Owner
Home Financials are based on the most recent Mortgage that was taken out on this home.
Original Mortgage
$294,500
Interest Rate
3.5%
Mortgage Type
New Conventional
Purchase Details
Closed on
Apr 29, 2013
Sold by
Miller Susan L and Miller Kelly T
Bought by
Banford Eric D and Dole Megan J
Home Financials for this Owner
Home Financials are based on the most recent Mortgage that was taken out on this home.
Original Mortgage
$6,300
Interest Rate
3.6%
Mortgage Type
Stand Alone Second
Purchase Details
Closed on
Aug 15, 2007
Sold by
Miller Susan L
Bought by
Miller Susan L and Miller Kelly T
Home Financials for this Owner
Home Financials are based on the most recent Mortgage that was taken out on this home.
Original Mortgage
$137,250
Interest Rate
6.66%
Mortgage Type
New Conventional
Purchase Details
Closed on
Aug 6, 2007
Sold by
Miller Susan L
Bought by
Miller Susan L
Home Financials for this Owner
Home Financials are based on the most recent Mortgage that was taken out on this home.
Original Mortgage
$137,250
Interest Rate
6.66%
Mortgage Type
New Conventional
Purchase Details
Closed on
Aug 22, 2000
Sold by
Miller Susan L and Miller Kelly T
Bought by
Miller Susan L
Home Financials for this Owner
Home Financials are based on the most recent Mortgage that was taken out on this home.
Original Mortgage
$89,500
Interest Rate
8.15%
Purchase Details
Closed on
Dec 19, 1998
Sold by
Brown Sharon Lee
Bought by
Miller Susan L and Miller Kelly T
Purchase Details
Closed on
Oct 20, 1998
Sold by
Brown Randy David and Brown Randy D
Bought by
Brown Sharon Lee and Brown Sharon L
Create a Home Valuation Report for This Property
The Home Valuation Report is an in-depth analysis detailing your home's value as well as a comparison with similar homes in the area
Home Values in the Area
Average Home Value in this Area
Purchase History
| Date | Buyer | Sale Price | Title Company |
|---|---|---|---|
| Geoghegan William Sean | -- | Titan Title | |
| Jackson Jeff Taylor | -- | Stewart Title Ins Ag | |
| Banford Eric D | -- | North American Title | |
| Miller Susan L | -- | Surety Title Agency | |
| Miller Susan L | -- | Surety Title Agency | |
| Miller Susan L | -- | Founders Title Co | |
| Miller Susan L | $97,000 | Founders Title Co | |
| Brown Sharon Lee | -- | -- |
Source: Public Records
Mortgage History
| Date | Status | Borrower | Loan Amount |
|---|---|---|---|
| Open | Geoghegan William Sean | $446,758 | |
| Previous Owner | Jackson Jeff Taylor | $294,500 | |
| Previous Owner | Banford Eric D | $6,300 | |
| Previous Owner | Banford Eric D | $157,102 | |
| Previous Owner | Miller Susan L | $137,250 | |
| Previous Owner | Miller Susan L | $89,500 |
Source: Public Records
Tax History Compared to Growth
Tax History
| Year | Tax Paid | Tax Assessment Tax Assessment Total Assessment is a certain percentage of the fair market value that is determined by local assessors to be the total taxable value of land and additions on the property. | Land | Improvement |
|---|---|---|---|---|
| 2025 | $3,118 | $250,800 | $119,363 | $131,437 |
| 2024 | $3,308 | $243,651 | $103,065 | $140,586 |
| 2023 | $2,457 | $423,000 | $192,972 | $230,028 |
| 2022 | $2,548 | $240,901 | $106,288 | $134,613 |
| 2021 | $2,372 | $343,000 | $138,956 | $204,044 |
| 2020 | $1,765 | $253,000 | $119,846 | $133,154 |
| 2019 | $1,954 | $250,000 | $134,649 | $115,351 |
| 2018 | $1,649 | $227,000 | $132,179 | $94,821 |
| 2016 | $1,389 | $98,891 | $52,421 | $46,470 |
| 2015 | $1,302 | $91,026 | $52,421 | $38,605 |
| 2014 | $1,414 | $98,358 | $52,421 | $45,937 |
| 2013 | -- | $108,102 | $36,190 | $71,912 |
Source: Public Records
Map
Nearby Homes
- 366 W 1000 N
- 790 N 500 W
- Lincoln Farmhouse Plan at Belmont Farms
- Belmont Traditional Plan at Belmont Farms
- Hampton Traditional Plan at Belmont Farms
- 1194 N 200 W
- 184 Park Shadows Cir
- 235 W 1400 N
- 1260 N 200 W
- 553 N 200 W
- 810 Park Shadows Cir
- 1410 N 200 W
- 499 N 200 W Unit 30
- 499 N 200 W Unit 19
- 106 W 700 N
- 399 W 400 N Unit 47
- 340 N 500 W Unit 204
- 1552 N 200 W
- 637 W 1600 N
- 29 W Lady Ln