1035 Pine Forest Dr S Siler City, NC 27344
Estimated Value: $511,000 - $624,000
3
Beds
4
Baths
3,618
Sq Ft
$154/Sq Ft
Est. Value
About This Home
This home is located at 1035 Pine Forest Dr S, Siler City, NC 27344 and is currently estimated at $558,474, approximately $154 per square foot. 1035 Pine Forest Dr S is a home located in Chatham County with nearby schools including Siler City Elementary School, Chatham Middle, and Jordan Matthews High.
Ownership History
Date
Name
Owned For
Owner Type
Purchase Details
Closed on
Jun 15, 2007
Sold by
Brinkley William A and Brinkley Dorothy V
Bought by
Brinkley William A and Brinkley Dorothy V
Current Estimated Value
Create a Home Valuation Report for This Property
The Home Valuation Report is an in-depth analysis detailing your home's value as well as a comparison with similar homes in the area
Home Values in the Area
Average Home Value in this Area
Purchase History
| Date | Buyer | Sale Price | Title Company |
|---|---|---|---|
| Brinkley William A | -- | None Available |
Source: Public Records
Tax History Compared to Growth
Tax History
| Year | Tax Paid | Tax Assessment Tax Assessment Total Assessment is a certain percentage of the fair market value that is determined by local assessors to be the total taxable value of land and additions on the property. | Land | Improvement |
|---|---|---|---|---|
| 2025 | $3,764 | $500,966 | $85,151 | $415,815 |
| 2024 | $3,764 | $342,949 | $75,690 | $267,259 |
| 2023 | $3,035 | $342,949 | $75,690 | $267,259 |
| 2022 | $2,692 | $342,949 | $75,690 | $267,259 |
| 2021 | $2,395 | $342,949 | $75,690 | $267,259 |
| 2020 | $2,395 | $333,516 | $67,500 | $266,016 |
| 2019 | $2,760 | $333,516 | $67,500 | $266,016 |
| 2018 | $0 | $333,516 | $67,500 | $266,016 |
| 2017 | $2,520 | $333,516 | $67,500 | $266,016 |
| 2016 | $3,147 | $422,189 | $67,500 | $354,689 |
| 2015 | $3,097 | $422,189 | $67,500 | $354,689 |
| 2014 | -- | $422,189 | $67,500 | $354,689 |
| 2013 | -- | $422,189 | $67,500 | $354,689 |
Source: Public Records
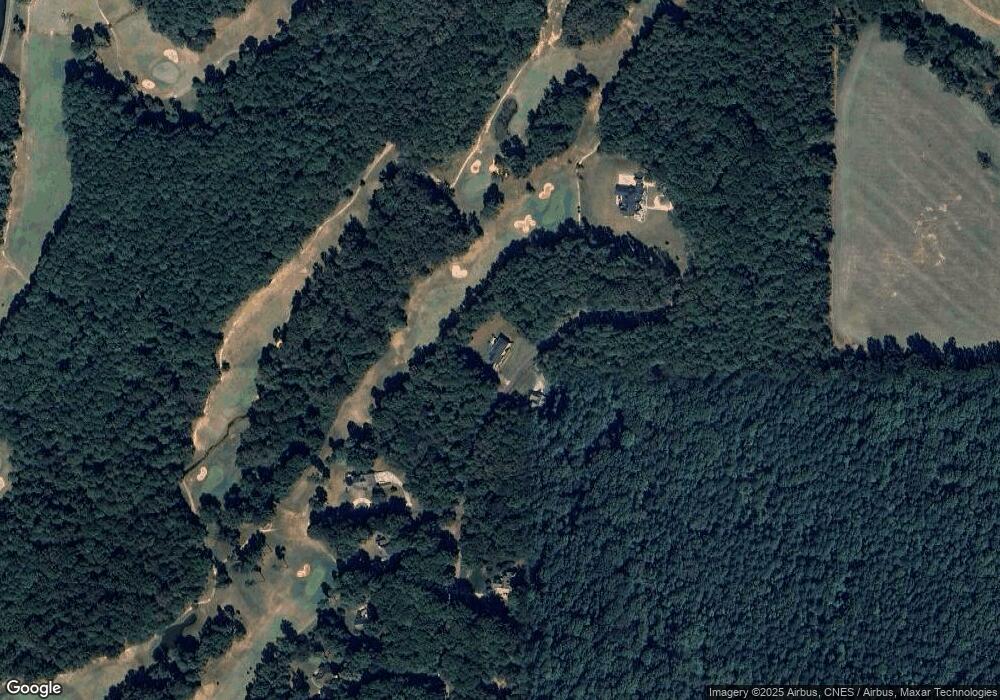
Map
Nearby Homes
- 254 Pine Forest Dr
- 191 Pine Lake Dr
- 11 Pine Forest Dr
- 9 Pine Court Dr
- 701 S Chatham Ave
- 513 W Glendale St
- 128 Olde Manor Ct
- 726 S 2nd Ave
- 303 W Dolphin St
- 519 W Raleigh St
- Tbd W 3rd St
- 4085 Alston Bridge Rd
- 1306 Sunset Dr
- 0 W 3rd St
- 803 Woodland Dr
- TBD E 3rd St
- 1201 Red Sunset Place
- 806 Cliftwood Dr
- 409 E 10th St
- 00 U S Highway 64
- 1008 Pine Forest Dr S
- 26 Olympic Ln
- 905 Pine Forest Dr S
- 890 Pine Forest Dr S
- 40 Pinehurst Ln
- 45 Pinehurst Ln
- 25 Pinehurst Ln
- 0 Pinehurst Ln
- 1053 Pine Forest South Dr
- 55 Pinehurst Ln
- 800 Pine Forest South Dr
- 791 Pine Forest Dr S
- 42 Turnberry Ln
- 725 Pine Forest Dr S
- 720 Pine Forest Dr
- 720 Pine Forest Dr Unit 183
- 36 Turnberry Ln
- 28 Turnberry Ln
- 25 Turnberry Ln
- 0 Turnberry Ln