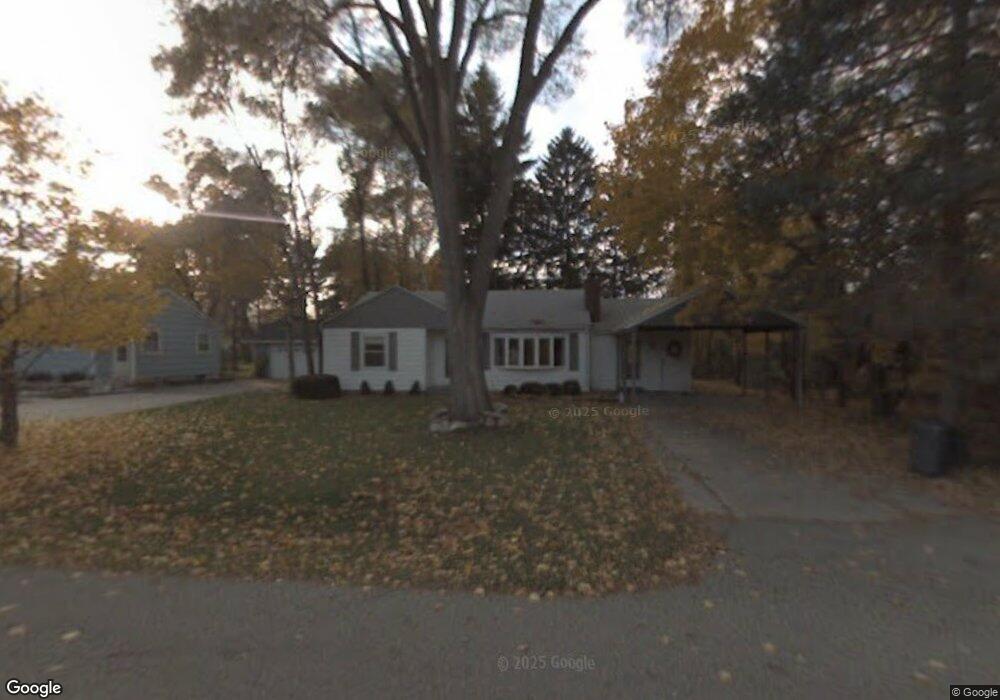
1035 Robb St East Lansing, MI 48823
Estimated Value: $208,136 - $228,000
3
Beds
1
Bath
1,200
Sq Ft
$183/Sq Ft
Est. Value
About This Home
This home is located at 1035 Robb St, East Lansing, MI 48823 and is currently estimated at $219,034, approximately $182 per square foot. 1035 Robb St is a home located in Ingham County with nearby schools including Marble Elementary School, MacDonald Middle School, and East Lansing High School.
Ownership History
Date
Name
Owned For
Owner Type
Purchase Details
Closed on
Jul 27, 2020
Sold by
Hosey Connor Eldon and Hosey Michael W
Bought by
Hosey Connor Eldon
Current Estimated Value
Purchase Details
Closed on
Jul 15, 2019
Sold by
Hosey Michael W
Bought by
Hosey Gabrielle Christine and Hosey Connor Eldon
Purchase Details
Closed on
Aug 1, 1989
Purchase Details
Closed on
Jul 1, 1983
Create a Home Valuation Report for This Property
The Home Valuation Report is an in-depth analysis detailing your home's value as well as a comparison with similar homes in the area
Home Values in the Area
Average Home Value in this Area
Purchase History
| Date | Buyer | Sale Price | Title Company |
|---|---|---|---|
| Hosey Connor Eldon | -- | None Available | |
| Hosey Gabrielle Christine | -- | None Available | |
| -- | $48,500 | -- | |
| -- | $45,000 | -- |
Source: Public Records
Tax History Compared to Growth
Tax History
| Year | Tax Paid | Tax Assessment Tax Assessment Total Assessment is a certain percentage of the fair market value that is determined by local assessors to be the total taxable value of land and additions on the property. | Land | Improvement |
|---|---|---|---|---|
| 2025 | $3,102 | $86,000 | $26,300 | $59,700 |
| 2024 | $26 | $78,800 | $24,200 | $54,600 |
| 2023 | $3,852 | $71,500 | $22,400 | $49,100 |
| 2022 | $3,685 | $65,700 | $19,400 | $46,300 |
| 2021 | $3,608 | $61,400 | $18,200 | $43,200 |
| 2020 | $3,566 | $58,000 | $17,300 | $40,700 |
| 2019 | $3,439 | $56,600 | $17,600 | $39,000 |
| 2018 | $3,660 | $53,400 | $14,600 | $38,800 |
| 2017 | $3,531 | $51,400 | $15,000 | $36,400 |
| 2016 | -- | $49,300 | $14,500 | $34,800 |
| 2015 | -- | $47,400 | $28,268 | $19,132 |
| 2014 | -- | $44,000 | $27,611 | $16,389 |
Source: Public Records
Map
Nearby Homes
- 1544 Haslett Rd
- 1719 Woodside Dr
- 933 Bedford Rd
- 1351 Foxcroft Rd
- 1539 N Hagadorn Rd Unit 1A
- 1531 Winchell Ct
- 688 Moorland Dr Unit 9
- 0 Hagadorn Lot D Rd
- 5900 N Hagadorn Rd
- 0 Hagadorn Lot C Rd Unit 50193276
- 586 Lexington Ave
- 894 Lenna Keith Cir
- 1511 Dennison Rd
- 1124 Burcham Dr
- 831 Lenna Keith Cir Unit 22
- 753 E Saginaw St
- 5604 Deville Ct
- 5435 Blue Haven Dr
- 1550 Ann St
- 5680 Deville Ct Unit 61
- 1025 Robb St
- 1544 Parkvale Ave
- 1606 Parkvale Ave
- 1036 Robb St
- 1026 Robb St
- 1538 Parkvale Ave
- 1535 Ridgewood Dr
- 1614 Parkvale Ave
- 1539 Parkvale Ave
- 1551 Parkvale Ave
- 1605 Ridgewood Dr
- 1525 Ridgewood Dr
- 1605 Parkvale Ave
- 1532 Parkvale Ave
- 1622 Parkvale Ave
- 1527 Parkvale Ave
- 1515 Ridgewood Dr
- 1615 Ridgewood Dr
- 1524 Parkvale Ave
- 1104 N Hagadorn Rd