10350 Newcombe Ct Westminster, CO 80021
Walnut Grove NeighborhoodEstimated Value: $539,000 - $586,000
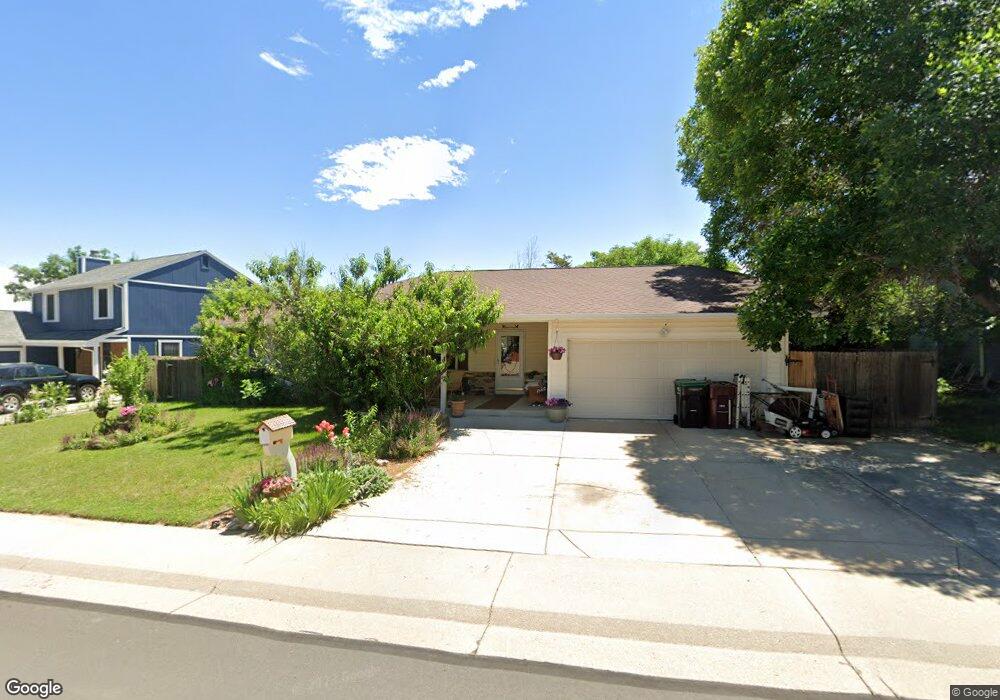
About This Home
This home is located at 10350 Newcombe Ct, Westminster, CO 80021 and is currently estimated at $561,165, approximately $397 per square foot. 10350 Newcombe Ct is a home located in Jefferson County with nearby schools including Lukas Elementary School, Wayne Carle Middle School, and Standley Lake High School.
Ownership History
We collect this data history from publicly available records. To have your information removed, we recommend requesting removal directly through your county’s website.
Purchase Details
Home Financials for this Owner
Home Financials are based on the most recent Mortgage that was taken out on this home.Purchase Details
Purchase Details
Purchase Details
Home Financials for this Owner
Home Financials are based on the most recent Mortgage that was taken out on this home.Home Values in the Area
Average Home Value in this Area
Purchase History
We collect this data history from publicly available records. To have your information removed, we recommend requesting removal directly through your county’s website.
| Date | Buyer | Sale Price | Title Company |
|---|---|---|---|
| $275,000 | National 1 Source Inc | ||
| -- | -- | ||
| $124,000 | Land Title | ||
| -- | Land Title |
Mortgage History
We collect this data history from publicly available records. To have your information removed, we recommend requesting removal directly through your county’s website.
| Date | Status | Borrower | Loan Amount |
|---|---|---|---|
| Open | $137,000 | ||
| Previous Owner | $110,500 |
Tax History
We collect this data history from publicly available records. To have your information removed, we recommend requesting removal directly through your county’s website.
| Year | Tax Paid | Tax Assessment Tax Assessment Total Assessment is a certain percentage of the fair market value that is determined by local assessors to be the total taxable value of land and additions on the property. | Land | Improvement |
|---|---|---|---|---|
| 2025 | $2,897 | $35,478 | $13,674 | $21,804 |
| 2024 | $2,743 | $36,013 | $15,442 | $20,571 |
| 2023 | $2,743 | $36,013 | $15,442 | $20,571 |
| 2022 | $2,211 | $28,428 | $9,218 | $19,210 |
| 2021 | $2,243 | $29,247 | $9,484 | $19,763 |
| 2020 | $2,032 | $26,637 | $8,877 | $17,760 |
| 2019 | $1,999 | $26,637 | $8,877 | $17,760 |
| 2018 | $1,831 | $23,592 | $7,102 | $16,490 |
| 2017 | $1,640 | $23,592 | $7,102 | $16,490 |
| 2016 | $1,547 | $20,652 | $6,794 | $13,858 |
| 2015 | $1,363 | $20,652 | $6,794 | $13,858 |
| 2014 | $1,363 | $16,963 | $6,408 | $10,555 |
Map
- 10550 W 102nd Place
- 10540 W 102nd Place
- 10413 Owens Cir
- 10376 Owens St
- 11203 W 102nd Dr
- 10454 Nelson St
- 11331 W 104th Ave
- 10513 Pierson Cir
- 10516 Robb Dr
- 10517 Robb Dr
- 10351 Routt St
- 10631 Quail St
- 10696 Newcombe St
- 10721 Owens St
- 11222 W 107th Ave
- 10745 Miller Ct
- 10541 Routt St
- 10702 Moore Way
- 10748 Routt St
- 11710 W 106th Place
- 10360 Newcombe Ct
- 10340 Newcombe Ct
- 10341 Newcombe St
- 10331 Newcombe St
- 10370 Newcombe Ct
- 10361 Newcombe Ct
- 10330 Newcombe Ct
- 10371 Newcombe Ct
- 10351 Newcombe St
- 10351 Newcombe Ct
- 10321 Newcombe St
- 10381 Newcombe Ct
- 10380 Newcombe Ct
- 10341 Newcombe Ct
- 10320 Newcombe Ct
- 10361 Newcombe St
- 10370 Oak St
- 10380 Oak St
- 10391 Newcombe Ct
- 10320 Newcombe St
Ask me questions while you tour the home.