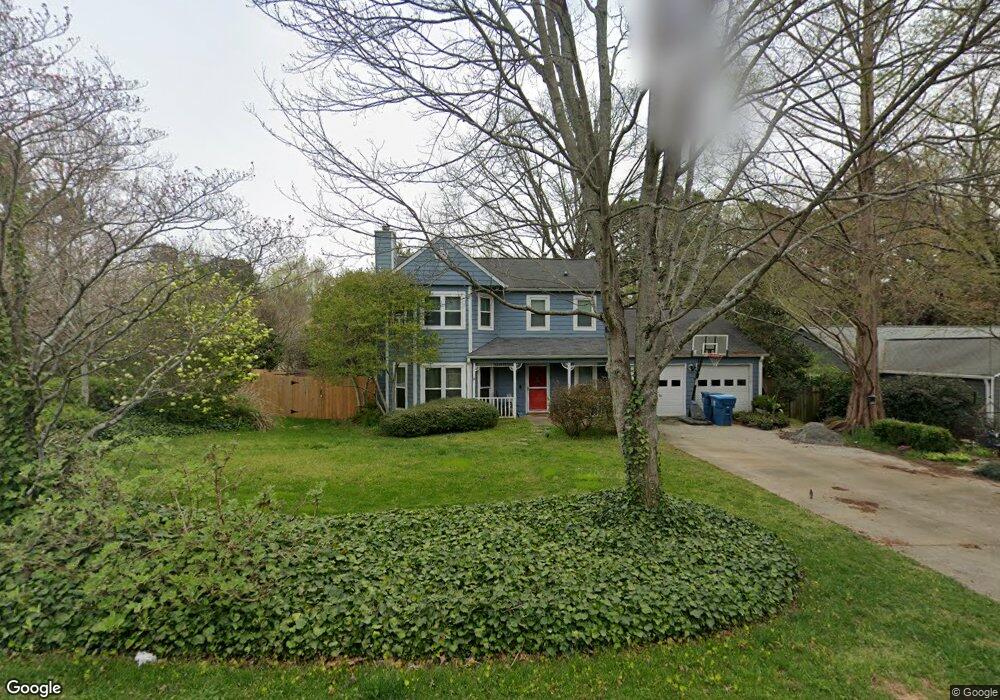
10355 Colony Glen Dr Unit 1 Alpharetta, GA 30022
Estimated Value: $420,000 - $436,724
3
Beds
3
Baths
1,320
Sq Ft
$323/Sq Ft
Est. Value
About This Home
This home is located at 10355 Colony Glen Dr Unit 1, Alpharetta, GA 30022 and is currently estimated at $426,681, approximately $323 per square foot. 10355 Colony Glen Dr Unit 1 is a home located in Fulton County with nearby schools including Dolvin Elementary School, Autrey Mill Middle School, and Johns Creek High School.
Ownership History
Date
Name
Owned For
Owner Type
Purchase Details
Closed on
Jul 12, 2004
Sold by
Leland Kathy and Leland Eric
Bought by
Hopper Christopher A
Current Estimated Value
Home Financials for this Owner
Home Financials are based on the most recent Mortgage that was taken out on this home.
Original Mortgage
$127,200
Outstanding Balance
$63,630
Interest Rate
6.24%
Mortgage Type
New Conventional
Estimated Equity
$363,051
Purchase Details
Closed on
Apr 11, 2001
Sold by
Leland Kathy
Bought by
Leland Kathy and Leland Erin H
Home Financials for this Owner
Home Financials are based on the most recent Mortgage that was taken out on this home.
Original Mortgage
$137,700
Interest Rate
6.98%
Mortgage Type
New Conventional
Purchase Details
Closed on
Jan 24, 1994
Sold by
Yarling James Melinda
Bought by
Obarr R Michael
Home Financials for this Owner
Home Financials are based on the most recent Mortgage that was taken out on this home.
Original Mortgage
$90,500
Interest Rate
7.17%
Mortgage Type
FHA
Create a Home Valuation Report for This Property
The Home Valuation Report is an in-depth analysis detailing your home's value as well as a comparison with similar homes in the area
Home Values in the Area
Average Home Value in this Area
Purchase History
| Date | Buyer | Sale Price | Title Company |
|---|---|---|---|
| Hopper Christopher A | $159,000 | -- | |
| Leland Kathy | -- | -- | |
| Leland Kathy | $142,000 | -- | |
| Obarr R Michael | $92,000 | -- |
Source: Public Records
Mortgage History
| Date | Status | Borrower | Loan Amount |
|---|---|---|---|
| Open | Hopper Christopher A | $127,200 | |
| Previous Owner | Leland Kathy | $137,700 | |
| Previous Owner | Obarr R Michael | $90,500 |
Source: Public Records
Tax History Compared to Growth
Tax History
| Year | Tax Paid | Tax Assessment Tax Assessment Total Assessment is a certain percentage of the fair market value that is determined by local assessors to be the total taxable value of land and additions on the property. | Land | Improvement |
|---|---|---|---|---|
| 2025 | $4,631 | $171,680 | $30,520 | $141,160 |
| 2023 | $4,065 | $144,000 | $31,360 | $112,640 |
| 2022 | $3,736 | $121,760 | $24,920 | $96,840 |
| 2021 | $3,059 | $97,080 | $17,640 | $79,440 |
| 2020 | $2,632 | $81,760 | $17,240 | $64,520 |
| 2019 | $317 | $80,280 | $16,920 | $63,360 |
| 2018 | $2,252 | $69,160 | $15,880 | $53,280 |
| 2017 | $1,607 | $47,200 | $13,680 | $33,520 |
| 2016 | $1,583 | $47,200 | $13,680 | $33,520 |
| 2015 | $1,601 | $47,200 | $13,680 | $33,520 |
| 2014 | $1,415 | $40,120 | $8,760 | $31,360 |
Source: Public Records
Map
Nearby Homes
- 10415 Plantation Bridge Dr
- 10405 Meadow Crest Ln
- 10515 Colony Glen Dr Unit 2
- 115 Willow View Point
- 10325 Oxford Mill Cir Unit 1
- 710 Country Manor Way
- 125 Thome Dr
- 120 Thome Dr
- 115 Thome Dr
- 415 Wood Trace Ct
- 350 Waters Bend Way
- 10050 Lauren Hall Ct
- 170 Autry Trail
- 10090 Jones Bridge Rd Unit 8
- 235 Wood Shoals Ct
- 285 Rolling Mist Ct
- 320 Outwood Mill Ct
- 10000 Barston Ct
- 3815 Falls Landing Dr
- 10880 Windham Way
- 10345 Colony Glen Dr Unit 1
- 205 Royal Colony Ct
- 10375 Colony Glen Dr
- 10340 Colony Glen Dr
- 215 Royal Colony Ct
- 200 Royal Colony Ct Unit 1
- 10335 Colony Glen Dr
- 170 Royal Colony Ct Unit 1
- 10385 Colony Glen Dr
- 0 Royal Colony Ct Unit 7494742
- 0 Royal Colony Ct Unit 8751082
- 0 Royal Colony Ct Unit 8398492
- 165 Royal Colony Ct
- 10330 Colony Glen Dr Unit 1
- 210 Royal Colony Ct
- 225 Royal Colony Ct
- 10395 Colony Glen Dr
- 155 Royal Colony Ct
- 160 Royal Colony Ct
- 10370 Colony Glen Dr