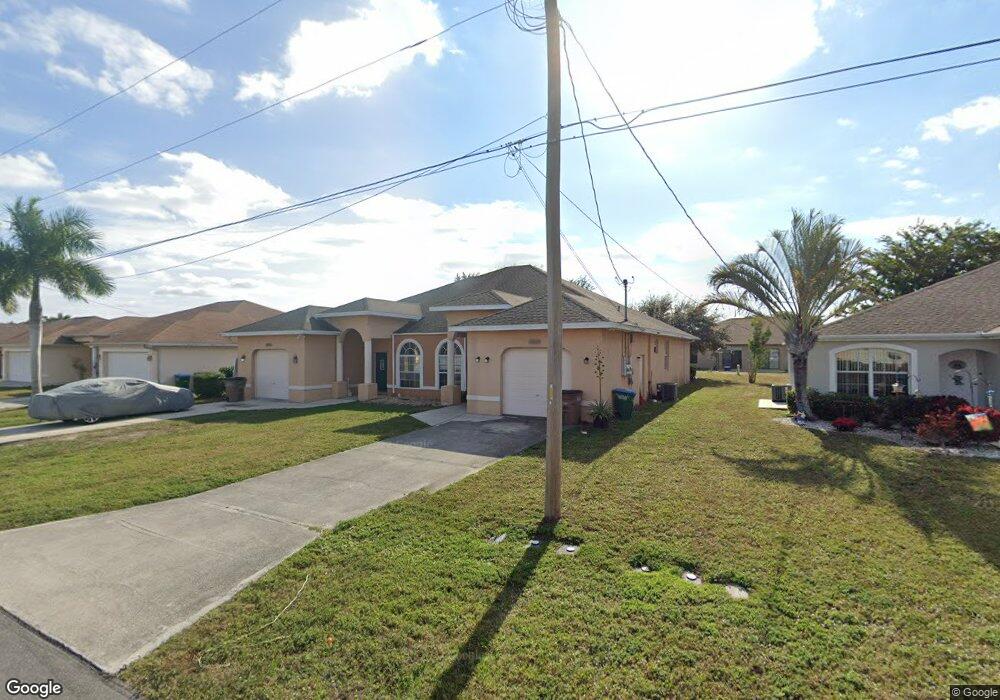
1036/1038 SE 11th Terrace Cape Coral, FL 33990
Hancock NeighborhoodEstimated Value: $482,000 - $595,000
4
Beds
4
Baths
2,806
Sq Ft
$188/Sq Ft
Est. Value
About This Home
This home is located at 1036/1038 SE 11th Terrace, Cape Coral, FL 33990 and is currently estimated at $528,333, approximately $188 per square foot. 1036/1038 SE 11th Terrace is a home with nearby schools including Caloosa Elementary School, Tropic Isles Elementary School, and Hancock Creek Elementary School.
Ownership History
Date
Name
Owned For
Owner Type
Purchase Details
Closed on
Apr 28, 2015
Sold by
Five Ten Florida Ii Llc
Bought by
Csma Ft Llc
Current Estimated Value
Purchase Details
Closed on
Mar 19, 2012
Sold by
Stubbs Cedric
Bought by
Five Ten Florida Ii Llc
Purchase Details
Closed on
Sep 13, 2010
Sold by
Stubbs Cedric
Bought by
Deutsche Bank National Trust Company
Purchase Details
Closed on
Nov 6, 2000
Sold by
Ralph Ralph and Ralph Monique M
Bought by
Stubbs Cedric and Stubbs Dechante
Home Financials for this Owner
Home Financials are based on the most recent Mortgage that was taken out on this home.
Original Mortgage
$108,500
Interest Rate
7.82%
Mortgage Type
Commercial
Purchase Details
Closed on
Nov 25, 1998
Sold by
City Of Cape Coral
Bought by
Ralph Clairmont J and Ralph Monique M
Purchase Details
Closed on
Mar 10, 1997
Sold by
Forman Geraldine
Bought by
City Of Cape Coral
Create a Home Valuation Report for This Property
The Home Valuation Report is an in-depth analysis detailing your home's value as well as a comparison with similar homes in the area
Home Values in the Area
Average Home Value in this Area
Purchase History
| Date | Buyer | Sale Price | Title Company |
|---|---|---|---|
| Csma Ft Llc | $4,270,700 | Avenue 365 Lender Services | |
| Five Ten Florida Ii Llc | $114,100 | None Available | |
| Deutsche Bank National Trust Company | $87,100 | None Available | |
| Stubbs Cedric | $160,000 | -- | |
| Ralph Clairmont J | $4,100 | -- | |
| City Of Cape Coral | -- | -- |
Source: Public Records
Mortgage History
| Date | Status | Borrower | Loan Amount |
|---|---|---|---|
| Previous Owner | Stubbs Cedric | $108,500 |
Source: Public Records
Tax History Compared to Growth
Tax History
| Year | Tax Paid | Tax Assessment Tax Assessment Total Assessment is a certain percentage of the fair market value that is determined by local assessors to be the total taxable value of land and additions on the property. | Land | Improvement |
|---|---|---|---|---|
| 2025 | $6,815 | $356,344 | -- | -- |
| 2024 | $6,815 | $323,949 | -- | -- |
| 2023 | $6,444 | $294,499 | $0 | $0 |
| 2022 | $5,842 | $267,726 | $0 | $0 |
| 2021 | $5,222 | $243,769 | $48,800 | $194,969 |
| 2020 | $4,957 | $221,261 | $48,800 | $172,461 |
| 2019 | $4,694 | $209,125 | $41,000 | $168,125 |
| 2018 | $4,813 | $211,592 | $35,000 | $176,592 |
Source: Public Records
Map
Nearby Homes
- 1138 SE 9th Ct
- 222 SE 10th Ave
- 1109 Country Club Blvd
- 1939 SE 10th Ave
- 904 SE 13th St Unit 201
- 1039 SE 10th St
- 1222 SE 8th Place
- 1207 SE 8th Place
- 1302, 1216, 1222 SE 8th Place
- 911 SE 13th Terrace
- 1001 SE 12th Ln
- 1234 SE 13th Ave
- 1403 SE 8th Place
- 1024 SE 14th Terrace
- 1416 SE 11th Place
- 628 Nicholas Pkwy E
- 627 SE 13th Terrace Unit A-D
- 1426 SE 8th Ave
- 1216 SE 13th Ave
- 307 SE 13th St
- 1036 SE 11th Terrace
- 1040 SE 11th Terrace
- 1042 SE 11th Terrace
- 1035 SE 12th St
- 1039/1041 SE 12th St
- 1028/1030 SE 11th Terrace
- 1037/1039 SE 11th Terrace
- 1031 SE 12th St
- 1033 SE 11th Terrace
- 1034 SE 11th Terrace
- 1041/1043 SE 11th Terrace
- 1029 SE 12th St
- 1029/1031 SE 11th Terrace
- 1031 SE 11th Terrace
- 1032 SE 11th Terrace Unit 4
- 1032 SE 11th Terrace Unit 2
- 1032 SE 11th Terrace
- 1032 SE 11th Terrace
- 1024/1026 SE 11th Terrace