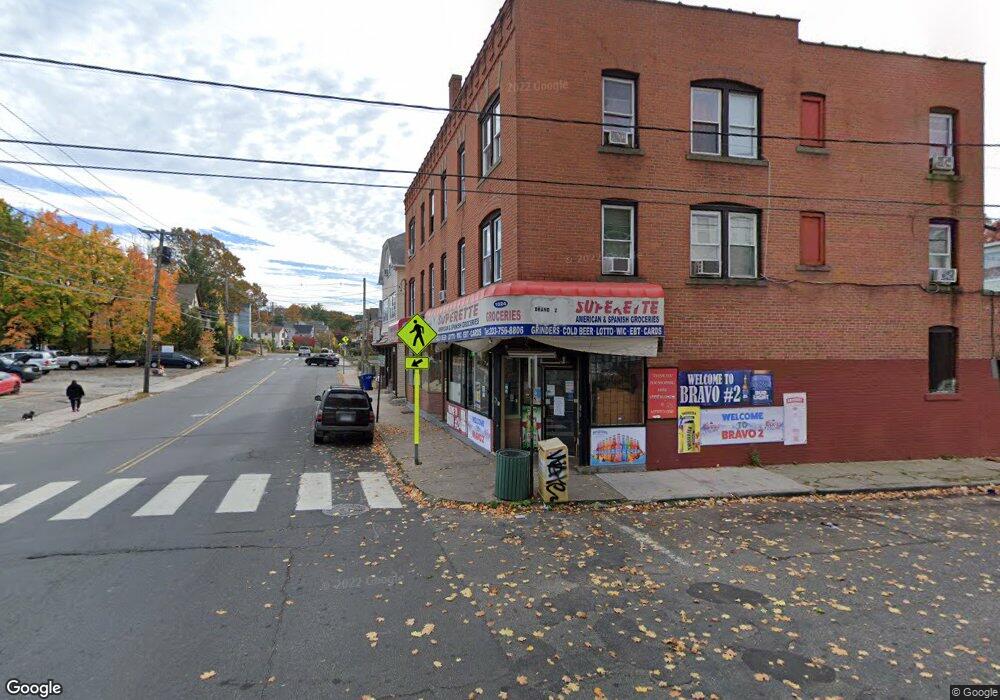
1036 Baldwin St Waterbury, CT 06706
South End District Neighborhood
--
Bed
--
Bath
2,340
Sq Ft
4,356
Sq Ft Lot
About This Home
This home is located at 1036 Baldwin St, Waterbury, CT 06706. 1036 Baldwin St is a home located in New Haven County with nearby schools including Washington School, West Side Middle School, and John F. Kennedy High School.
Ownership History
Date
Name
Owned For
Owner Type
Purchase Details
Closed on
Mar 23, 2015
Sold by
Freddie Mac
Bought by
N & D Llc
Purchase Details
Closed on
Apr 15, 2010
Sold by
Fnma
Bought by
Golines Reay Llc
Purchase Details
Closed on
Apr 9, 2010
Sold by
Bac Home Loans Svcng L
Bought by
Federal National Mortgage Association
Purchase Details
Closed on
Feb 2, 2010
Sold by
Chica Hector and Gonzalez John
Bought by
Bac Home Loans Svcng L
Purchase Details
Closed on
Oct 23, 2006
Sold by
Carlos Antonio S and Carlos Maria M
Bought by
Gonzalez John and Chica Hector
Home Financials for this Owner
Home Financials are based on the most recent Mortgage that was taken out on this home.
Original Mortgage
$164,800
Interest Rate
6.49%
Mortgage Type
Commercial
Create a Home Valuation Report for This Property
The Home Valuation Report is an in-depth analysis detailing your home's value as well as a comparison with similar homes in the area
Home Values in the Area
Average Home Value in this Area
Purchase History
| Date | Buyer | Sale Price | Title Company |
|---|---|---|---|
| N & D Llc | $70,000 | -- | |
| Golines Reay Llc | $82,500 | -- | |
| Federal National Mortgage Association | -- | -- | |
| Bac Home Loans Svcng L | -- | -- | |
| Gonzalez John | $206,000 | -- |
Source: Public Records
Mortgage History
| Date | Status | Borrower | Loan Amount |
|---|---|---|---|
| Previous Owner | Gonzalez John | $20,000 | |
| Previous Owner | Gonzalez John | $164,800 | |
| Previous Owner | Gonzalez John | $70,000 |
Source: Public Records
Tax History Compared to Growth
Tax History
| Year | Tax Paid | Tax Assessment Tax Assessment Total Assessment is a certain percentage of the fair market value that is determined by local assessors to be the total taxable value of land and additions on the property. | Land | Improvement |
|---|---|---|---|---|
| 2025 | $4,512 | $100,310 | $31,920 | $68,390 |
| 2024 | $4,959 | $100,310 | $31,920 | $68,390 |
| 2023 | $5,436 | $100,310 | $31,920 | $68,390 |
| 2022 | $4,117 | $68,370 | $31,920 | $36,450 |
| 2021 | $4,117 | $68,370 | $31,920 | $36,450 |
| 2020 | $4,117 | $68,370 | $31,920 | $36,450 |
| 2019 | $4,117 | $68,370 | $31,920 | $36,450 |
| 2018 | $4,117 | $68,370 | $31,920 | $36,450 |
| 2017 | $4,275 | $71,000 | $31,930 | $39,070 |
| 2016 | $4,275 | $71,000 | $31,930 | $39,070 |
| 2015 | $4,134 | $71,000 | $31,930 | $39,070 |
| 2014 | $4,134 | $71,000 | $31,930 | $39,070 |
Source: Public Records
Map
Nearby Homes
- 40 Laval St
- 41 Laval St
- 127 Lounsbury St
- 915 S Main St
- 140 Edgewood Ave
- 0372 Floyd St
- 41L Floyd St
- 0039 Floyd St
- 00 Milton Ave
- 146 Charles St
- 439 Piedmont St
- 51 Clover St
- 137 Greenmount Terrace
- 335 Raymond St
- 32 Ridge St
- 124 Geddes Terrace
- 381 Congress Ave
- 562 Piedmont St
- 171 Kelsey St
- 35 Pearl Lake Rd Unit B