Estimated Value: $133,000 - $196,000
2
Beds
2
Baths
917
Sq Ft
$176/Sq Ft
Est. Value
About This Home
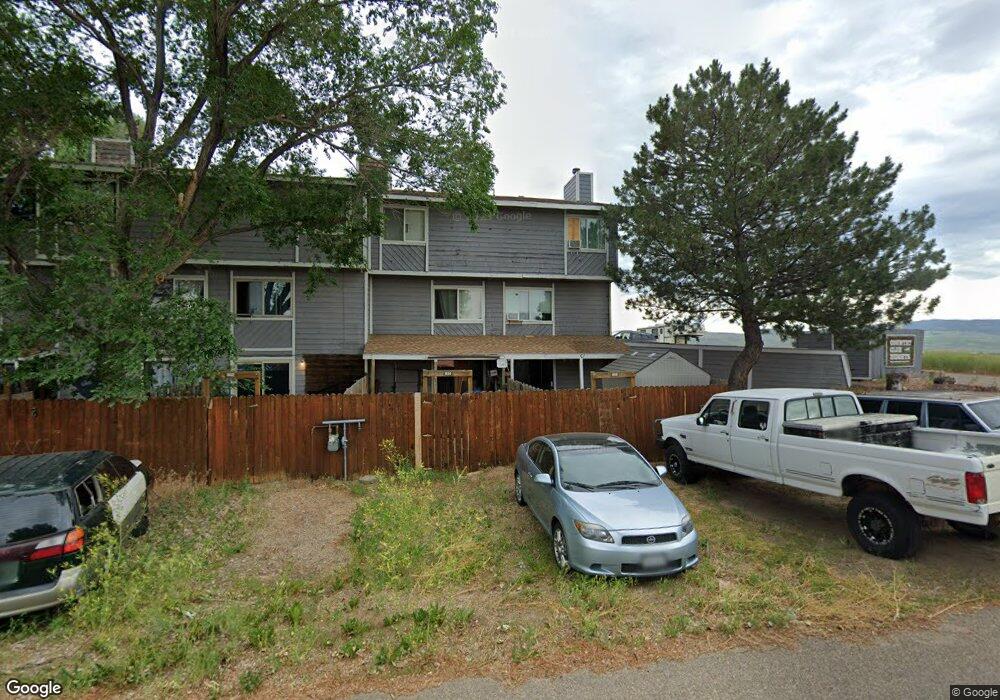
This home is located at 1036 E 7th St, Craig, CO 81625 and is currently estimated at $160,987, approximately $175 per square foot. 1036 E 7th St is a home located in Moffat County with nearby schools including Sandrock Elementary School, Moffat County High School, and Calvary Baptist School.
Ownership History
Date
Name
Owned For
Owner Type
Purchase Details
Closed on
Jan 27, 2016
Sold by
Ncm Acquisitions Llc
Bought by
Ncm Holdings Llc
Current Estimated Value
Purchase Details
Closed on
Oct 14, 2015
Sold by
Jones Todd J
Bought by
Ncm Acquisitions Llc
Purchase Details
Closed on
Apr 28, 2006
Sold by
Jones Todd J
Bought by
Jones Todd J and Jones Monique
Home Financials for this Owner
Home Financials are based on the most recent Mortgage that was taken out on this home.
Original Mortgage
$60,000
Interest Rate
6.5%
Mortgage Type
New Conventional
Purchase Details
Closed on
Feb 26, 2000
Sold by
Ncm Holdings Llc
Bought by
Hope Garrett and Hope Desiree
Home Financials for this Owner
Home Financials are based on the most recent Mortgage that was taken out on this home.
Original Mortgage
$80,808
Interest Rate
2.7%
Mortgage Type
New Conventional
Create a Home Valuation Report for This Property
The Home Valuation Report is an in-depth analysis detailing your home's value as well as a comparison with similar homes in the area
Purchase History
| Date | Buyer | Sale Price | Title Company |
|---|---|---|---|
| Ncm Holdings Llc | -- | None Available | |
| Ncm Acquisitions Llc | -- | None Available | |
| Jones Todd J | -- | None Available | |
| Hope Garrett | $80,000 | Land Title Guarantee |
Source: Public Records
Mortgage History
| Date | Status | Borrower | Loan Amount |
|---|---|---|---|
| Previous Owner | Jones Todd J | $60,000 | |
| Previous Owner | Hope Garrett | $80,808 |
Source: Public Records
Tax History
| Year | Tax Paid | Tax Assessment Tax Assessment Total Assessment is a certain percentage of the fair market value that is determined by local assessors to be the total taxable value of land and additions on the property. | Land | Improvement |
|---|---|---|---|---|
| 2025 | $785 | $8,547 | $0 | $0 |
| 2024 | $785 | $4,280 | $0 | $0 |
| 2023 | $371 | $4,280 | $140 | $4,140 |
| 2022 | $547 | $6,490 | $270 | $6,220 |
| 2021 | $552 | $6,670 | $270 | $6,400 |
| 2020 | $517 | $6,320 | $270 | $6,050 |
| 2019 | $512 | $6,320 | $270 | $6,050 |
| 2018 | $465 | $5,710 | $270 | $5,440 |
| 2017 | $479 | $5,710 | $270 | $5,440 |
| 2016 | $557 | $6,860 | $300 | $6,560 |
| 2015 | $565 | $6,860 | $300 | $6,560 |
| 2013 | $565 | $6,860 | $300 | $6,560 |
Source: Public Records
Map
Nearby Homes
- 1018 E 7th St
- 825 E 7th St Unit 1
- TBD E 7th St
- 769 Legion St
- 870 Jerimiah Ave
- 1540 E Victory Way
- 858 E 10th St
- 1500 Lecuyer Dr
- 997 E 10th St
- 000 Washington St
- 761 Rose St
- 869 Washington St
- 901 Van Dorn Dr
- 805 Rose St
- 886 Washington St
- 430 E 4th St Unit 17
- TBD E Victory Way
- 396 E 9th St
- 982 Langford Dr
- 952 E 11th St
Your Personal Tour Guide
Ask me questions while you tour the home.