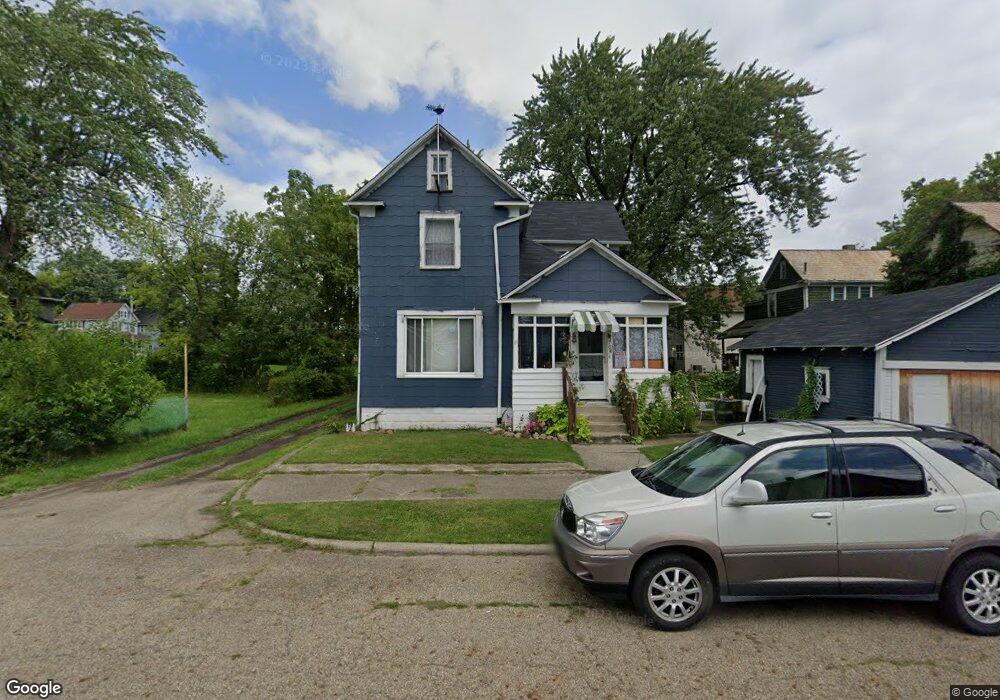
1036 E Grant St Alliance, OH 44601
Estimated Value: $44,000 - $102,000
3
Beds
2
Baths
1,380
Sq Ft
$55/Sq Ft
Est. Value
About This Home
This home is located at 1036 E Grant St, Alliance, OH 44601 and is currently estimated at $76,248, approximately $55 per square foot. 1036 E Grant St is a home located in Stark County with nearby schools including Alliance Elementary School at Rockhill, Alliance Intermediate School at Northside, and Alliance Middle School.
Ownership History
Date
Name
Owned For
Owner Type
Purchase Details
Closed on
Jul 24, 2017
Sold by
Snodgrass Vivian D
Bought by
Lanham Douglas E
Current Estimated Value
Purchase Details
Closed on
Sep 20, 1999
Sold by
Payton Joyce A
Bought by
Snodgrass John H and Snodgrass Darlene Vivian
Purchase Details
Closed on
Oct 17, 1996
Sold by
Porter Leola B
Bought by
Payton Joyce A
Create a Home Valuation Report for This Property
The Home Valuation Report is an in-depth analysis detailing your home's value as well as a comparison with similar homes in the area
Home Values in the Area
Average Home Value in this Area
Purchase History
| Date | Buyer | Sale Price | Title Company |
|---|---|---|---|
| Lanham Douglas E | -- | None Available | |
| Snodgrass John H | $8,700 | Union Title Company | |
| Payton Joyce A | $13,100 | -- |
Source: Public Records
Tax History Compared to Growth
Tax History
| Year | Tax Paid | Tax Assessment Tax Assessment Total Assessment is a certain percentage of the fair market value that is determined by local assessors to be the total taxable value of land and additions on the property. | Land | Improvement |
|---|---|---|---|---|
| 2025 | -- | $12,290 | $2,700 | $9,590 |
| 2024 | -- | $12,290 | $2,700 | $9,590 |
| 2023 | $369 | $9,180 | $2,770 | $6,410 |
| 2022 | $371 | $9,180 | $2,770 | $6,410 |
| 2021 | $371 | $9,180 | $2,770 | $6,410 |
| 2020 | $388 | $8,960 | $2,380 | $6,580 |
| 2019 | $382 | $8,960 | $2,380 | $6,580 |
| 2018 | $433 | $8,960 | $2,380 | $6,580 |
| 2017 | $347 | $7,740 | $2,000 | $5,740 |
| 2016 | $794 | $10,860 | $2,000 | $8,860 |
| 2015 | $496 | $10,860 | $2,000 | $8,860 |
| 2014 | $302 | $6,300 | $1,820 | $4,480 |
| 2013 | $151 | $6,300 | $1,820 | $4,480 |
Source: Public Records
Map
Nearby Homes
- 831 Wade Ave
- 814 Milner St
- 1044 S Liberty Ave
- 1233 Woodland Ave
- 442 S Liberty Ave
- 1005 S Freedom Ave
- 452 E Summit St
- 1395 S Webb Ave
- 551 South St
- 1175 S Freedom Ave
- 729 Waugh St
- V/L S Fredeom Ave
- 432 S Linden Ave
- 815 Grace St
- 142 S Seneca Ave
- 356 E Broadway St
- 1437 S Linden Ave
- 1214 Jersey St
- 361 E Main St
- 263 Franklin Ave
- 1046 E Grant St
- 755 Woodland Ave
- 1006 E Grant St
- 756 Wade Ave
- 746 Wade Ave
- 737 Woodland Ave
- 1035 E Grant St
- 1011 E Grant St
- 1019 E Grant St
- 1104 E Grant St
- 736 Wade Ave
- 826 Wade Ave
- 1103 E Grant St
- 765 Wade Ave
- 755 Wade Ave
- 1113 E Grant St
- 943 E Grant St
- 736 Woodland Ave
- 736 Woodland Ave
- 1029 E Summit St